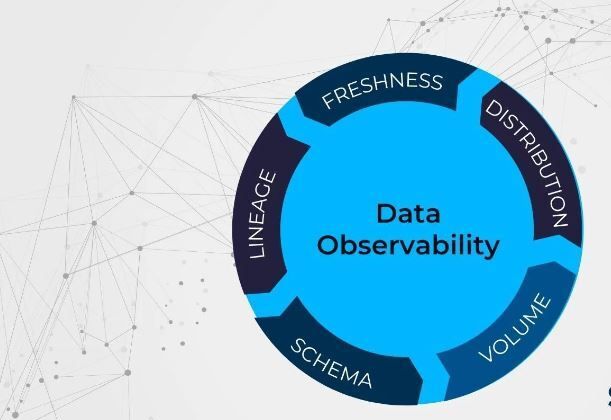
What is Observability?
Observability is going beyond just analysing the data and rather it is more to do with providing granular recommendations in the form of actionable insights based on current and historic MELT data points (Monitoring, Events, Logs & Traces).
Why is Observability important?
A cloud-native observability platform is designed to handle the demands of network-centric microservices architecture. It uses advanced telemetry streaming and storage architectures that observe highly distributed applications with precision.
How to do Observability?
There are five stages of Observability Maturity Model:
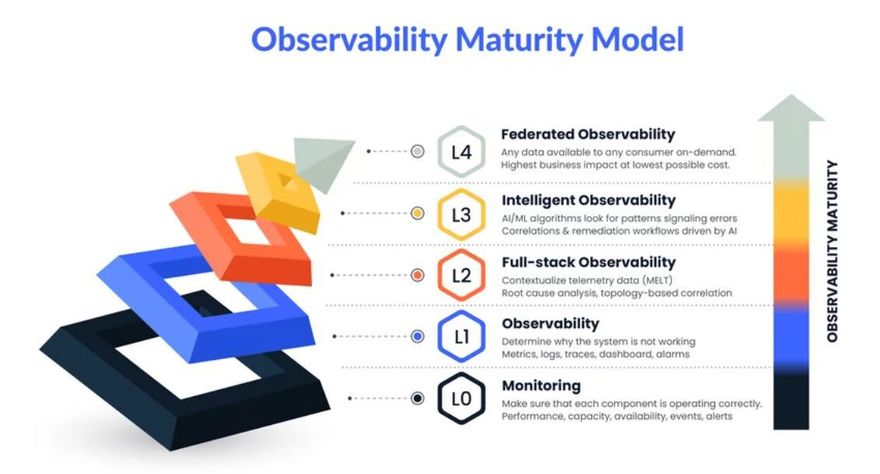
Stage 1: Monitoring (Is everything in working order?)
Monitoring answers the simple question of “Whether the individual components are functioning as expected or not?”
Monitoring is the process of analyzing a pre-determined set of numbers and failure situations.
It monitors the component-level metrics including performance, capacity, and availability, and issues alerts if a monitored value is changed.
Simply put, monitoring lets you know how your system is performing, whether any components are failing or breaking down, and what the status of each one is.
It's a crucial first step that lays the groundwork for more advanced monitoring techniques.
In a nutshell, monitoring is about the following things:
Monitoring the general health of each component in an IT system.
Examining events and setting off alarms and notifications.
Notifying you that a problem occurred.
Stage 2: Observability (Why is it not working?)
Observability applies the same principles as monitoring to a much-advanced level, allowing you to discover new failure modes.
At its core, it allows you to identify and comprehend things about which you can't predict failure modes in advance.
Therefore, Observability is the degree to which an internal system’s states may be deduced from external sources. Metrics, logs, and traces have traditionally been used as the three pillars of observable data.
An example of dataobservability is the use of distributed tracing, which tracks the flow of requests and responses through a distributed system. This can help organizations understand how different components of their systems are interacting, and identify bottlenecks or other issues that may be impacting performance.
Stage 3: Full-Stack Observability (What is the origin of the problem, and what are its consequences?)
With Full-Stack Observability, you can contextualize events, logs, metrics, and traces from across the data silos in your infrastructure to discover how your observability data is connected.
By outlining the organizational structure of your company's processes and applications, you'll be able to understand how everything changes over time at this stage.
The easiest approach to figuring out what caused an incident is to look at what actually changed. So to see how the connections between your stack's components evolved over time, you must be able to chart how the relationships among its parts have unfolded.
This is referred to as the level of insight, which allows you to follow cause and effect across your infrastructure.
Stage 4: Intelligent Observability (How to predict anomalies and automate response?)
At stage 4 observability, AI/ML algorithms look for patterns signaling errors correlation and remediation workflows driven by AI. In other words, observability is intelligent at this stage.
This layer also builds off previous levels' capabilities such as collecting and processing information, topology assembly, and data correlation - adding pattern recognition, anomaly detection, and other refined recommendations for remediation.
Some key benefits attributed to stage 4 observability include the following:
Deep insights into how the operations of the IT environment work utilizing AI/ML to collect and correlate useful information from vast amounts of data.
Anomaly detection and predictions that identify problems before they have an impact on the business.
Improved productivity and less work as teams concentrate on the most important events.
Increased accuracy of alert correlation, performance review, and intelligent #rootcauseanalysis
Stage 5: Federated Observability (How to make it accessible and available to all?)
The next step in the observability data model deals with the idea of openobservability
In other words, data availability for consumers with on-demand convenience.
The objective of developing and incorporating the 5th stage into the model is the democratization of data. This brings about better workflows, conspicuous consumption models, and enhanced cost management practices besides a plethora of other elements.
With the new observability maturity model, it’s anticipated that the dangling backlogs of the earlier stages will be rectified.
Federated observability is imperative, in that it has become the need of the hour.
To keep up with the unprecedented shift in volume and security, therefore, federated observability is bound to be embraced in the cloud community

Top comments (0)