What is Observability and its advantage?
Observabiity is a superset of monitoring, where the monitored events are correlated and enriched to provide context of the issues as well as the cause and analysis of the underlying issues that contributed to degradation of performance and availability.
Advantages of observability includes:
i. Capable of handling rapid changes to the systems, architecture and technonlogies in monitoring the entites.
ii. Provides a deeper understanding and correlation of an issue, the reason for the issue.
What is the difference between monitoring and observability?
Monitoring is the passive, reactive method of ensuring application and infrastructure availability to provide current status of the application availability. It is static in nature where the metrics collected are related to application / infrastructure - up/down, application performance is degraded with minimal insights on the causes.
Observability is the active and predictive method of ensuring application and infrastructure availabiltiy to ensure application health. It is dynamic in nature where the metrics collected are correlated to potential underlying causes that could contribute to issues with availabilty and performance of applications and infrastructure.
What is Datadog?
Datadog is a service that provides observability solutions for a wide range (more than 600+) of application technologies, infrastructure, network, security, availability and end user monitoring. It is an enterprise SaaS product that is designed to work on VMs as well as containerized infrasatructures.
What is Datadog agent and how does it work?
The Datadog Agent collects data from various sources, including:
Metrics: It collects system-level and application-level metrics, such as CPU usage, memory usage, disk space, and custom application metrics.
Traces: It can collect distributed traces from applications instrumented with APM (Application Performance Monitoring) libraries.
Logs: It can collect logs from log files, Docker containers, Kubernetes pods, and more.
Integrations: Datadog provides integrations for a wide range of technologies and services, including databases, web servers, cloud providers, and more. The agent collects data from these integrations.
The collected metrics are converted to Datadog compatible format and transmits it securely to Datadog backend.
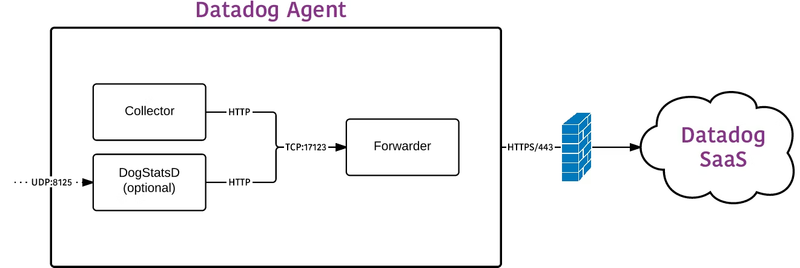
Component of Datadog Agent and short intro for each.
The 3 main components of the Datadog agent are Collector, DogstatsD and Forwarder.
Collector: The Collector is the core component of the Datadog Agent responsible for gathering metrics, traces, and logs. It collects, aggregates and processes data from various sources, including system-level metrics, application-level metrics, distributed traces, and log files.
DogstatsD: DogstatsD is a StatsD based daemon service that is used for collecting custom application metrics such as throughput, response times and application server side errors.
Forwarder: Forwarder is the component responsbile for collecting the metrics from Collector and DogstatsD to the Datadog backend in a secured manner.
Top 10 commands of Datadog Agent
- datadog-agent status
- systemctl stop datadog-agent
- systemctl start datadog-agent
- systemctl status datadog-agent
- datadog-agent configcheck
- datadog-agent config
- datadog-agent health
- datadog-agent version
- more /var/log/datadog/agent.log
- more /etc/datadog-agent/datadog.yaml
Locate how to enable Process monitoring in datadog.yaml?
Edit the Live processes section as follows:
process_config:
process_collection:
enabled: "true"
Top 5 Techniques for troubleshooting Datadog Agent
- Windows - use the Logs section of the Datadog agent manager
- Linux - command: more /var/log/datadog/agent.log
- Linux - command: more /var/log/datadog/process-agent.log
- Linux - command: datadog-agent status
- Linux - command: datadog-agent configcheck
Write down the steps to collect apache metrices to datadog
- Install Datadog host agent for ubuntu (OS of choice)
- Install Apache HTTPD using aptget
- Modify the index.html under /var/www/html/ and reload and restart apache service.
- In Datadog SaaS, search for Apache under integrations, and click on Install Integration.
- In the Ubuntu host, go to /etc/datadog-agent/conf.d/apache.d/ and create a new file or copy the example yaml with the name conf.yaml.
- Restart datadog agent.
- Simulate traffic with command - hile true; do curl -s -o /dev/null http://localhost & done
Write down the steps to collect tomcat metrices to datadog
- Install Datadog host agent for Ubuntu (OS of choice).
- Install JDK on the host with apt-get and apt install ofjdk.
- Install Apache tomcat by downloading the ZIP file of the version required and unzipping in /opt.
- Change permissions to all the scripts under /opt/apache-tomcat/bin to execute files.
- Modify the catalina.sh file to enable JMX by adding the code snippet -
CATALINA_OPTS="-Dcom.sun.management.jmxremote -Dcom.sun.management.jmxremote.port=9012 -Dcom.sun.management.jmxremote.ssl=false -Dcom.sun.management.jmxremote.authenticate=false
- Go to tomacat.d folder in /etc/datadog-agent/conf.d/ and copy / create a yaml file of the name conf.yaml.
- Restart datadog agent with systemctl commands.
- In Datadog SaaS, search for Tomcat under integrations, and click on Install Integration.
- Open the tomcat UI on the browser with port 8080 and click on the webpage to simulate traffic.
Write down the steps to collect docker metrices to datadog
Install Datadog agent on Ubuntu (OS of choice).
Configure the datadog-agent.yaml to allow live process monitoring under the section process_config.
Restart the datadog agent.
Configure apt to connect to and get packages over https.
Add docker's GPG key.
Set up the repository and install docker and required packages with apt-get.
In Datadog SaaS, search for Docker under integrations, and click on Install Integration.
Create or copy the yaml file under docker.d in the datadog agent conf and update the instances to: - url: "unix://var/run/docker.sock"
Restart datadog agent and check datadog config.
Create new docker containers docker run -itd ubuntu.
Container metrics will be collected and can be viewed under metrics explorer.
Top 10 metrics/indicators for APM
- Requests - no. of requests the application has received in a given time period.
- P50 Latency -
- P95 Latency -
- Error rate -
- Status Code -
- Logs
- Transactions
- Traces
- Spans
- Resource
Top 10 metrics/indicators for Synthetic monitoring
- Request Method
- Response Status
- Response Time
- Response Time by location
- Events
- Response body
- Assertions
- Trace
- Test ID
- Tags
Top 10 metrics/indicators for RUM
- User sessions
- User views
- Response Status for actions
- Response Time for actions
- Long tasks
- Session error count
- Session time spent
- Durations
- Trace
- Error type, message & stack
- Frustration signals

Top comments (0)