Linux commands to monitor and debugging url performance
Testing database performance and optimizing a database
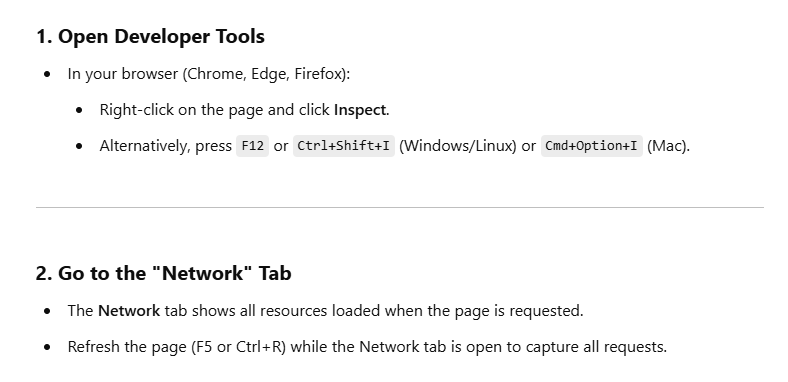
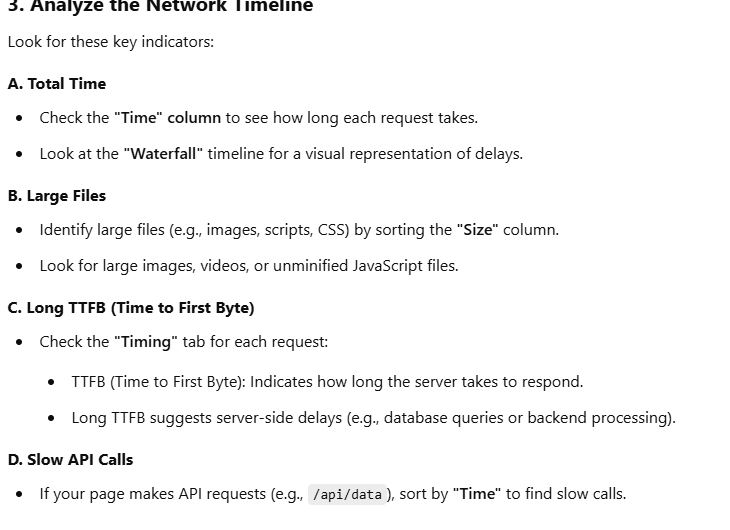
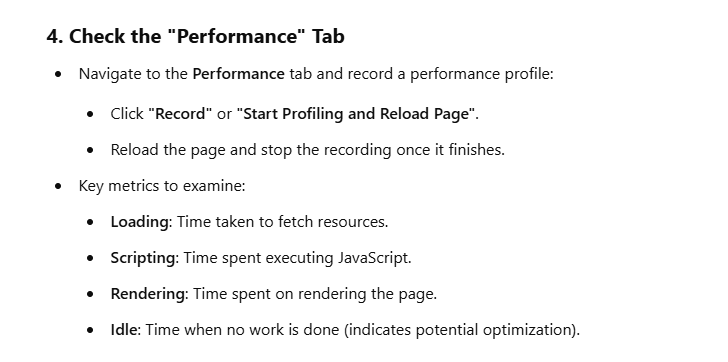
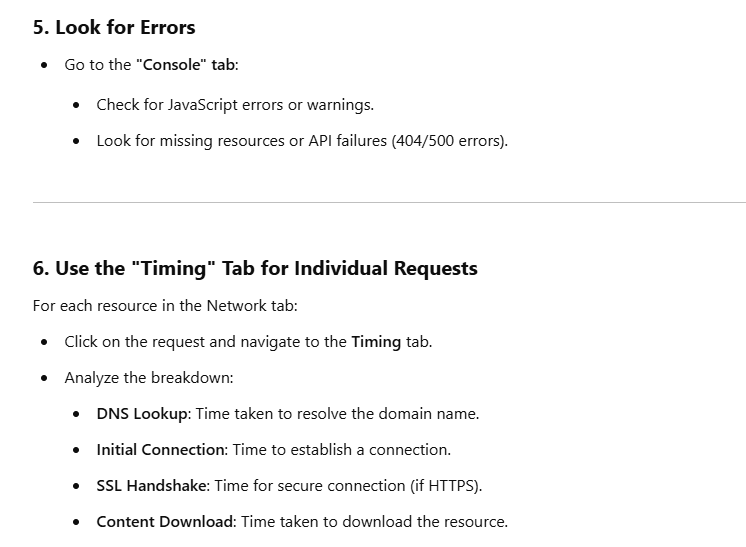
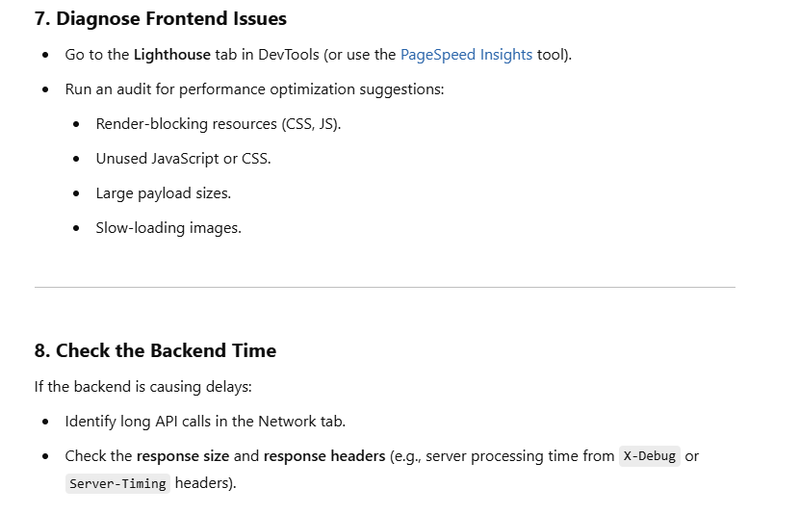
browser's developer tools (Inspect) to monitor url performance
Linux commands to monitor and debugging url performance
Server Load
Reason:
More users might access the server in the afternoon, increasing the load.
Scheduled processes (e.g., backups, cron jobs) might run during that time, affecting performance.
Mitigation:
Monitor server load using tools like New Relic, Datadog, or server logs.
Scale server resources during peak hours using load balancers and auto-scaling.
Optimize server processes to avoid running resource-intensive tasks during peak times.
Network Traffic
Reason:
Increased internet traffic in your area or data center during the afternoon.
ISP throttling or routing inefficiencies.
Mitigation:
Use a Content Delivery Network (CDN) like Cloudflare or AWS CloudFront to cache and distribute content closer to users.
Monitor network performance and switch ISPs or improve bandwidth if necessary.
Application Performance
Reason:
Suboptimal application code, such as slow database queries or inefficient APIs.
Dependency bottlenecks, e.g., third-party API response delays.
Mitigation:
Profile and optimize your application using APM tools.
Implement database query optimization and caching (e.g., Redis, Memcached).
Use asynchronous operations where possible to handle delays gracefully.
Database Load
Reason:
High read/write operations during the afternoon due to increased user activity.
Long-running queries or lack of indexing.
Mitigation:
Use read replicas or sharding to distribute database load.
Optimize and index frequently used queries.
Implement caching for frequently accessed data.
Resource Contention
Reason:
Shared hosting environments might have higher resource contention during peak hours.
Mitigation:
Switch to dedicated servers or cloud services.
Use containerization (e.g., Docker, Kubernetes) to isolate resources.
Geographic Considerations
Reason:
Users from different geographic regions accessing the site during specific times.
Increased latency due to server location relative to users.
Mitigation:
Use geo-distributed servers or edge computing to minimize latency.
Leverage CDNs for static assets.
Scheduled Maintenance or Updates
Reason:
Scheduled updates or backups during the afternoon could temporarily affect performance.
Mitigation:
Reschedule updates or maintenance to off-peak hours.
Use rolling updates to minimize downtime.
Browser or Local Machine Issues
Reason:
Local caching issues or slow device performance.
Mitigation:
Test on multiple devices and browsers.
Clear cache or use incognito mode to rule out browser-related issues.
Monitoring and Diagnostic Steps:
Log Analysis: Check application and server logs to identify slow processes or errors.
Performance Testing: Use tools like Apache JMeter, LoadRunner, or k6 to simulate load at different times.
Real User Monitoring (RUM): Track real user behavior and performance with tools like Google Analytics or Hotjar.
By identifying and addressing the specific bottleneck, you can significantly improve the URL's performance across all time periods.
Check Server Load
uptime
Displays the current load average to determine if the server is under stress.
Monitor Resource Usage
top
Monitors real-time CPU, memory, and process usage.
Detailed Process Analysis
htop
Interactive tool to analyze resource-intensive processes.
Check Disk Usage
df -h
Ensures there’s enough free disk space for smooth operations.
Monitor Disk I/O
iostat -x 5
Provides insights into disk I/O performance every 5 seconds.
Check Memory Usage
free -m
Displays memory usage to see if RAM is a bottleneck.
Analyze Network Activity
ifstat
Monitors real-time network interface usage.
Test Network Latency
ping -c 4 yourwebsite.com
Checks the latency and packet loss to the server.
Check Open Connections
netstat -anp | grep :80
Lists all active connections to the web server.
Test Website Speed
curl -w "@curl-format.txt" -o /dev/null -s https://yourwebsite.com
Measures detailed timing for your website's response. Create curl-format.txt with:
time_namelookup: %{time_namelookup}s\n
time_connect: %{time_connect}s\n
time_starttransfer: %{time_starttransfer}s\n
Analyze Logs
tail -n 50 /var/log/nginx/access.log
Checks recent requests to identify slow requests.
tail -n 50 /var/log/nginx/error.log
Views recent errors in the web server.
tail -n 50 /opt/lampp/logs/error_log
Example Output:
[Mon Nov 27 14:02:15.145904 2024] [mpm_prefork:error] [pid 7470] AH00161: server reached MaxRequestWorkers setting
[Mon Nov 27 14:02:45.561781 2024] [core:warn] [pid 7470] AH00045: child process 7481 still did not exit
Analysis:
The MaxRequestWorkers error indicates the server cannot handle more simultaneous requests.
Mitigation:
Increase the MaxRequestWorkers value in Apache's configuration file
(/etc/httpd/conf/httpd.conf):
<IfModule mpm_prefork_module>
    MaxRequestWorkers 250
</IfModule>
Then restart Apache:
sudo systemctl restart httpd
Test Database Performance
mysql -u root -p -e "SHOW FULL PROCESSLIST;"
Identifies slow database queries.
Optimize Database
mysqlcheck -u root -p --optimize --all-databases
Optimizes all databases for better performance.
Check Cron Jobs
crontab -l
Ensures no resource-heavy cron jobs are running during peak times.
Monitor Scheduled Jobs
atq
Lists scheduled jobs using the at command.
Test DNS Resolution
dig yourwebsite.com
Checks DNS resolution time.
Check Bandwidth Usage
nload
Real-time visualization of incoming and outgoing bandwidth.
Restart Web Server
sudo systemctl restart nginx
Restarts the web server to resolve potential stuck processes.
Clear Cache
sudo sync; echo 3 > /proc/sys/vm/drop_caches
Clears the system cache to free up memory.
Load Testing
ab -n 1000 -c 50 https://yourwebsite.com/
Simulates 1,000 requests with 50 concurrent users to identify performance bottlenecks.
Investigate Suspicious Processes
ps -eo user,pid,%cpu,%mem,comm --sort=-%cpu | grep daemon
ps -eo user,pid,%cpu,%mem,comm --sort=-%cpu | grep daemon
Example Output:
USER       PID %CPU %MEM COMMAND
daemon    38041 3.5  0.1 /opt/lampp/bin/httpd
daemon    38064 2.3  0.1 /opt/lampp/bin/httpd
daemon    897   0.0  0.0 /usr/sbin/atd
Analysis:
The atd process might be running scheduled tasks.
The httpd processes consuming CPU might indicate that your Apache server is under load.
Mitigation:
Investigate the atd process:
ps -fp 897
Output:
UID        PID  PPID  C STIME TTY      TIME     CMD
daemon     897     1  0 Jan29 ?        00:00:00 /usr/sbin/atd
Check scheduled jobs:
atq
Output:
Tue Nov 28 14:00:00 2024 a root
If the job is unnecessary, remove it:
atrm 3
Testing database performance and optimizing a database
Test Connection Time
time mysql -u root -p -e "SELECT 1;"
Example Output:
real    0m0.015s
user    0m0.002s
sys     0m0.003s
Purpose: Measures the time it takes to establish a connection and run a simple query. A high real time indicates connection delays or resource issues.
- Show Active Queries
mysql -u root -p -e "SHOW FULL PROCESSLIST;"
Example Output:
Id      User    Host      db      Command  Time  State        Info
10123   root    localhost mydb    Query     45   Sending data SELECT * FROM large_table;
Purpose: Identifies long-running queries. In this case, query ID 10123 has been running for 45 seconds.
Optimization: Investigate slow queries and optimize them (e.g., adding indexes).
Analyze Query Execution Plan
mysql -u root -p -e "EXPLAIN SELECT * FROM large_table WHERE column_name = 'value';"
Example Output:
+----+-------------+-------------+------+---------------+------+---------+------+--------+-------------+
| id | select_type | table       | type | possible_keys | key  | key_len | ref  | rows   | Extra       |
+----+-------------+-------------+------+---------------+------+---------+------+--------+-------------+
|  1 | SIMPLE      | large_table | ALL  | NULL          | NULL | NULL    | NULL | 500000 | Using where |
+----+-------------+-------------+------+---------------+------+---------+------+--------+-------------+
Purpose: Identifies performance issues like full table scans (type = ALL).
Optimization:
Add indexes to avoid full table scans:
CREATE INDEX idx_column_name ON large_table(column_name);
Check Database Size
mysql -u root -p -e "SELECT table_schema AS 'Database', SUM(data_length + index_length) / 1024 / 1024 AS 'Size (MB)' FROM information_schema.tables GROUP BY table_schema;"
Example Output:
+----------+-----------+
| Database | Size (MB) |
+----------+-----------+
| mydb     | 1250.00   |
| testdb   | 200.50    |
+----------+-----------+
Purpose: Identifies large databases that may need optimization or archiving.
Optimize Tables
mysqlcheck -u root -p --optimize --databases mydb
Example Output:
mydb.large_table                          OK
mydb.small_table                          OK
Purpose: Optimizes tables by defragmenting them and reclaiming disk space.
Check Query Cache Usage
mysql -u root -p -e "SHOW VARIABLES LIKE 'query_cache_size';"
Example Output:
+------------------+---------+
| Variable_name    | Value   |
+------------------+---------+
| query_cache_size | 1048576 |
+------------------+---------+
Purpose: Displays the size of the query cache.
Optimization: If the cache size is 0, enable it:
SET GLOBAL query_cache_size = 10485760; -- Set 10 MB cache
Identify Missing Indexes
mysql -u root -p -e "SHOW INDEX FROM large_table;"
Example Output:
+-------+------------+----------------+--------------+-------------+
| Table | Non_unique | Key_name       | Seq_in_index | Column_name |
+-------+------------+----------------+--------------+-------------+
| large_table | 1      | PRIMARY        | 1            | id          |
+-------+------------+----------------+--------------+-------------+
Purpose: Identifies if there are no secondary indexes.
Optimization: Add missing indexes:
CREATE INDEX idx_column_name ON large_table(column_name);
- Monitor Database Connections
mysqladmin -u root -p processlist
Example Output:
+----+------+-----------+----+---------+------+-------+------------------+
| Id | User | Host      | db | Command | Time | State | Info             |
+----+------+-----------+----+---------+------+-------+------------------+
| 3  | root | localhost | mydb | Sleep | 300  |       | NULL             |
| 4  | root | localhost | mydb | Query | 10   | NULL  | SELECT * FROM ...|
+----+------+-----------+----+---------+------+-------+------------------+
Purpose: Detects idle or slow queries.
Optimization: Kill long-running queries if necessary:
mysqladmin -u root -p kill <Id>
- Analyze Table Fragmentation mysql -u root -p -e "SHOW TABLE STATUS FROM mydb LIKE 'large_table';" Example Output:
+-------------+--------+---------+------------+------+------------+----------+
| Name | Engine | Version | Row_format | Rows | Data_length | Data_free|
+-------------+--------+---------+------------+------+------------+----------+
| large_table | InnoDB | 10 | Compact | 5000 | 5242880 | 1048576 |
+-------------+--------+---------+------------+------+------------+----------+
Purpose: Identifies fragmentation in the Data_free column.
Optimization: Defragment the table:
OPTIMIZE TABLE large_table;
- Backup and Analyze Slow Logs Enable slow query logs:
mysql -u root -p -e "SET GLOBAL slow_query_log = 1; SET GLOBAL long_query_time = 1;"
Example Log Output:
# Time: 2024-11-27T14:00:00
# Query_time: 3.2s  Lock_time: 0.0s  Rows_sent: 100000  Rows_examined: 100000
SELECT * FROM large_table WHERE column_name LIKE '%value%';
Purpose: Logs queries that take longer than 1 second.
Optimization:
Refactor the query to use indexes or reduce result size:
SELECT column_name FROM large_table WHERE column_name = 'value';
Final Notes:
These commands cover database performance diagnostics and optimizations. Adjust the solutions based on your database engine (e.g., MySQL, MariaDB) and specific workload needs. Let me know if you need further details on any step!
browser's developer tools (Inspect) to monitor url performance
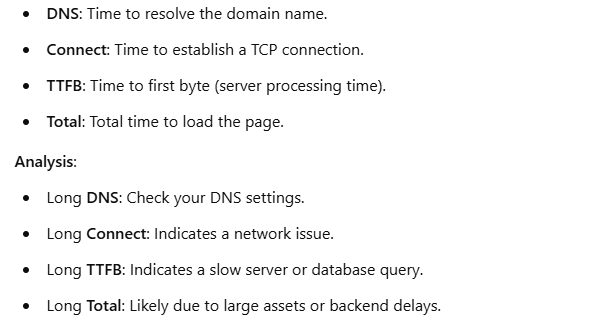
Measure URL Response Time
curl -o /dev/null -s -w "DNS: %{time_namelookup}\nConnect: %{time_connect}\nTTFB: %{time_starttransfer}\nTotal: %{time_total}\n" https://yourwebsite.com
DNS: 0.021
Connect: 0.056
TTFB: 0.345
Total: 1.234
Trace Request Path
Use traceroute to see the path your request takes and identify slow network hops.
traceroute yourwebsite.com
Output Example:
 1  192.168.0.1 (192.168.0.1)  1.123 ms  1.432 ms  1.876 ms
 2  10.10.10.1 (10.10.10.1)    5.234 ms  5.564 ms  6.004 ms
 3  slow-hop.com (203.0.113.1) 45.234 ms 46.987 ms 47.543 ms
Analysis:
High latency at a specific hop indicates a network issue with that route. Contact your ISP or hosting provider.
- Monitor Active Connections Check if too many users are accessing the server, which could slow down responses.
netstat -tunapl
Output Example:
Proto Recv-Q Send-Q Local Address           Foreign Address         State       PID/Program name
tcp        0      0 0.0.0.0:80              0.0.0.0:*               LISTEN      7470/httpd
tcp        0      0 192.168.0.1:80          203.0.113.2:56789       ESTABLISHED 7470/httpd
Analysis:
Many ESTABLISHED connections on port 80/443 might indicate high traffic. Consider adding a load balancer or rate limiter.
- Check Resource Usage Use top or htop to monitor CPU, memory, and process activity.
top
Output Example:
PID   USER      PR  NI    VIRT    RES    SHR   S  %CPU  %MEM  TIME+ COMMAND
7470  www-data  20   0  405472  12564   8724  S   85.2   1.0  12:45.23 httpd
38664 mysql     20   0 1464452 122964   2232  S   72.3   2.2   8:12.78 mysqld
Analysis:
High CPU usage for httpd or mysqld indicates that web server or database is overburdened.
- Check Web Server Logs Inspect the server logs for errors or slow requests.
tail -n 50 /var/log/apache2/access.log
Output Example:
203.0.113.2 - - [27/Nov/2024:12:00:01 +0000] "GET /api/endpoint HTTP/1.1" 200 153 "-" "Mozilla/5.0" 5.123
Analysis:
The number 5.123 at the end indicates the time taken to process the request. Long times suggest server-side issues.
- Debug Database Performance Check the database for slow queries.
Identify Active Queries:
mysql -u root -p -e "SHOW FULL PROCESSLIST;"
Output Example:
Id      User    Host      db      Command  Time   State        Info
10123   root    localhost mydb    Query    120    Sending data SELECT * FROM large_table;
Analysis:
A query taking 120 seconds is a bottleneck.
Enable Slow Query Log:
mysql -u root -p -e "SET GLOBAL slow_query_log = 1; SET GLOBAL long_query_time = 1;"
Inspect the slow query log:
tail -n 50 /var/log/mysql/slow.log
- Test Disk I/O Performance If your server is disk-bound, it might be slowing down the database or file reads.
iotop
Output Example:
Total DISK READ :    10.00 M/s | Total DISK WRITE :     5.00 M/s
PID  USER   DISK READ  DISK WRITE  COMMAND
1234 root    5.00 M/s   0.00 M/s   mysqld
5678 www-data 4.00 M/s  2.00 M/s   httpd
Analysis:
High disk I/O usage by mysqld or httpd may indicate the need for faster disks (e.g., SSDs).
- Monitor Network Usage Use iftop to monitor real-time network bandwidth usage.
iftop
Output Example:
192.168.0.1       => 203.0.113.2       5.45Mb    5.45Mb   5.45Mb
192.168.0.1       <= 203.0.113.2       4.95Mb    4.95Mb   4.95Mb
Analysis:
High incoming traffic could indicate a DDoS attack or legitimate heavy load.
- Trace PHP Execution Use strace to trace the system calls made by a process (e.g., PHP or web server).
strace -p <PID>
Output Example:
open("/var/www/html/large_file.php", O_RDONLY) = 3
read(3, "<?php include 'config.php'; ...", 8192) = 8192
Analysis:
Long delays between open() and read() might indicate file system or application issues.
- Analyze Page Rendering Use apachebench (ab) or a similar tool to simulate traffic and measure page response times.
ab -n 100 -c 10 https://yourwebsite.com/
Output Example:
Requests per second:    20 [#/sec] (mean)
Time per request:       50.000 [ms] (mean)
Analysis:
Low requests per second or high time per request indicates a backend bottleneck.

Top comments (0)