There are several statistical tools that can be used to calculate and evaluate the null hypothesis in hypothesis testing. Here are some commonly used statistical tools along with examples:
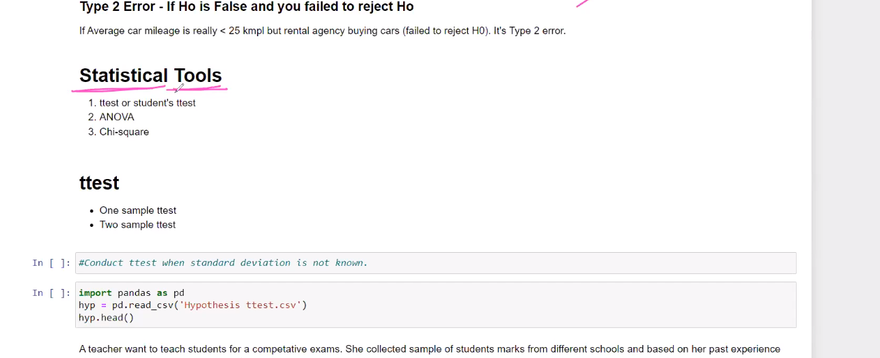
Student's t-test:
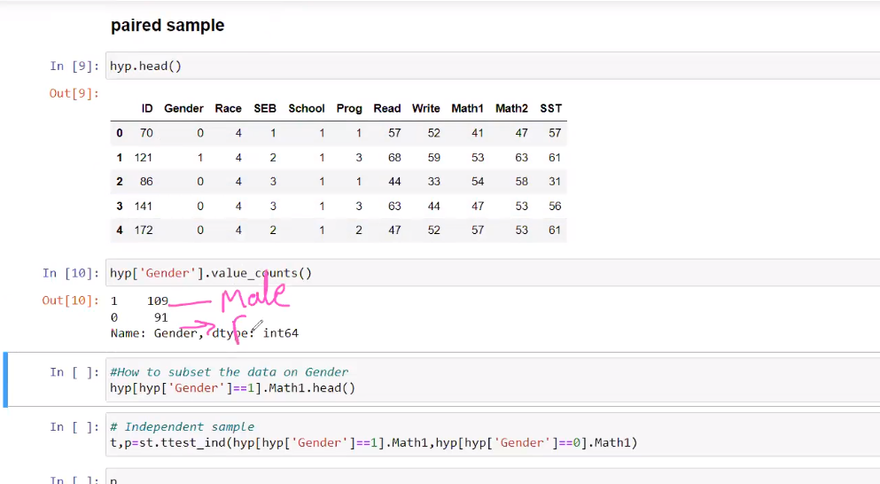
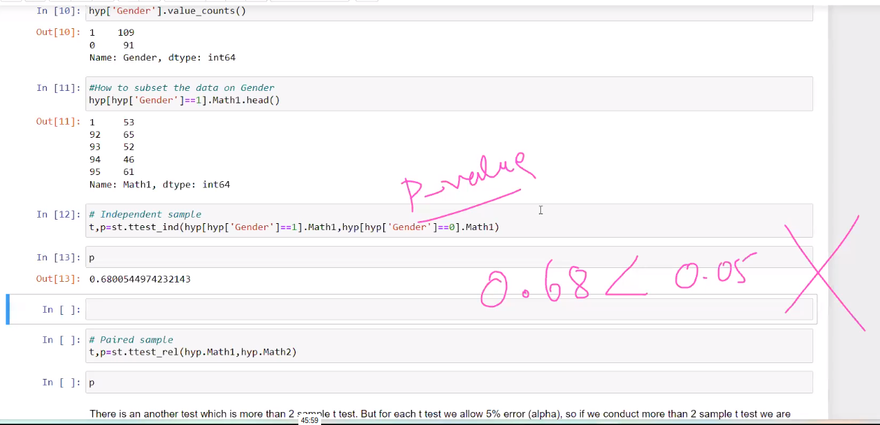
The t-test is used to compare the means of two groups and determine if there is a statistically significant difference between them. It can be used for both independent samples (independent t-test) and paired samples (paired t-test). The t-test assumes that the data follows a normal distribution.
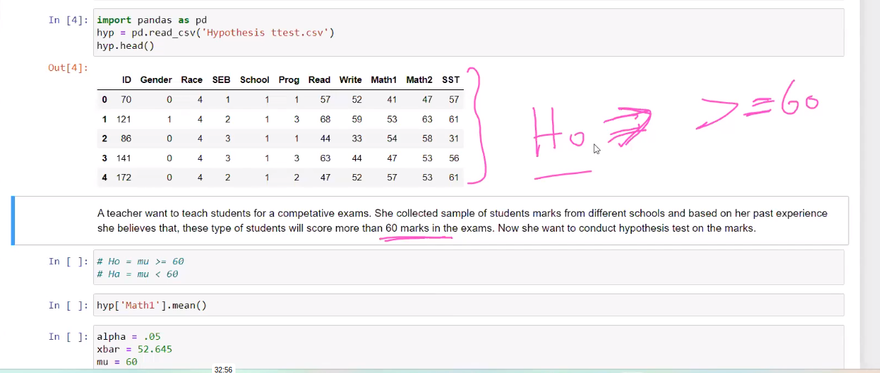
Example: Suppose we want to compare the average scores of two groups of students, Group A and Group B, to determine if there is a significant difference. We can use an independent two-sample t-test to test the null hypothesis that the means of the two groups are equal.
To illustrate the two types of errors in hypothesis testing, Type I and Type II errors, using real data from a CSV file, we can consider an example of comparing the average scores of two groups. Here's a Python code example:
import pandas as pd
from scipy import stats
# Load data from CSV
data = pd.read_csv('scores.csv')
# Extract scores for two groups
group_a_scores = data[data['Group'] == 'A']['Score']
group_b_scores = data[data['Group'] == 'B']['Score']
# Perform independent two-sample t-test
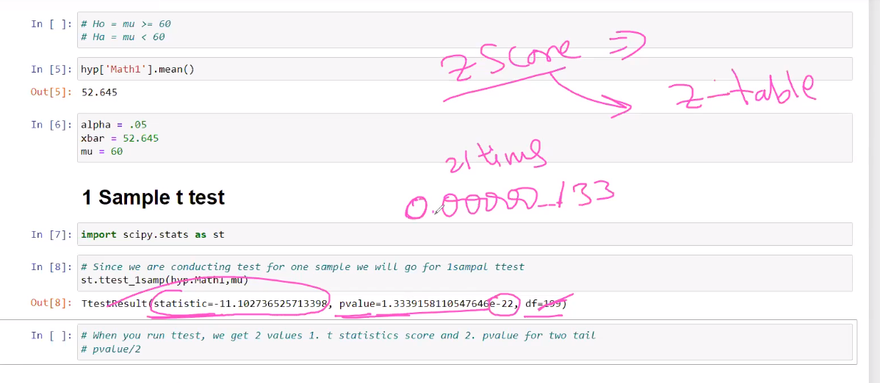
t_statistic, p_value = stats.ttest_ind(group_a_scores, group_b_scores)
# Set significance level
alpha = 0.05
# Check for Type I error
if p_value < alpha:
print("Type I Error occurred: Reject the null hypothesis (False positive).")
else:
print("No Type I Error: Fail to reject the null hypothesis.")
# Check for Type II error
if p_value > alpha:
print("Type II Error occurred: Fail to reject the null hypothesis (False negative).")
else:
print("No Type II Error: Reject the null hypothesis.")
In this example, we assume that the data is stored in a CSV file named 'scores.csv'. The CSV file should have two columns: 'Group' (representing the group membership, e.g., 'A' and 'B') and 'Score' (representing the exam scores for each group).
The code loads the data from the CSV file using pd.read_csv(). It then extracts the scores for Group A and Group B from the loaded data. The independent two-sample t-test is performed using stats.ttest_ind() to compare the means of the two groups.
Next, we set the significance level (alpha) to 0.05, representing a common threshold for hypothesis testing. We check for Type I error by comparing the obtained p-value with the significance level. If the p-value is less than the significance level, we conclude that a Type I error occurred (rejecting the null hypothesis incorrectly).
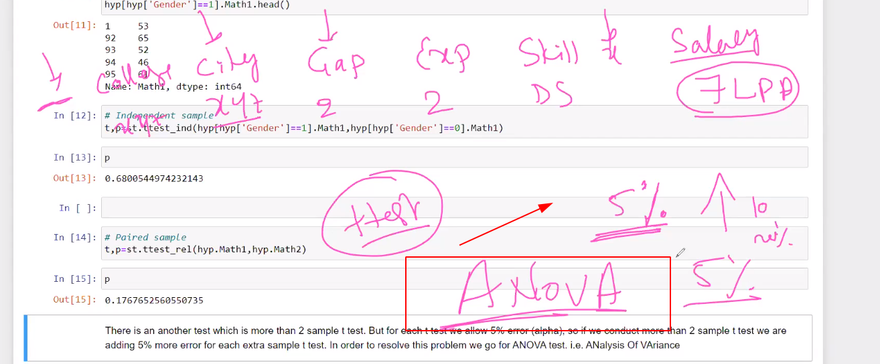
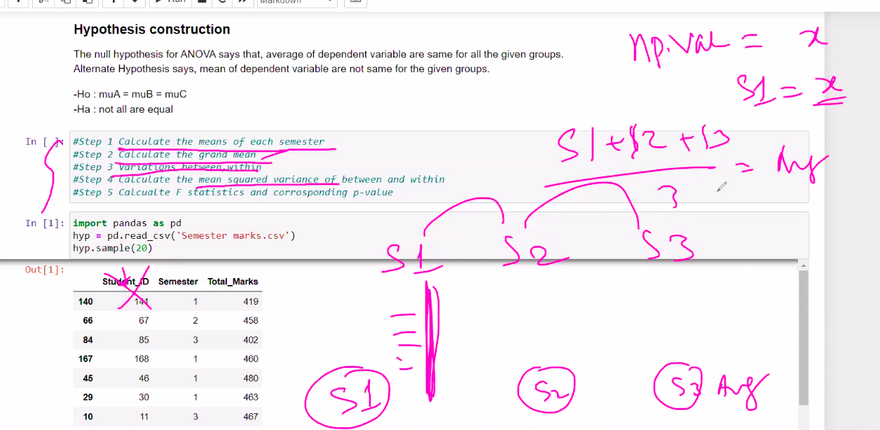
Analysis of Variance (ANOVA):
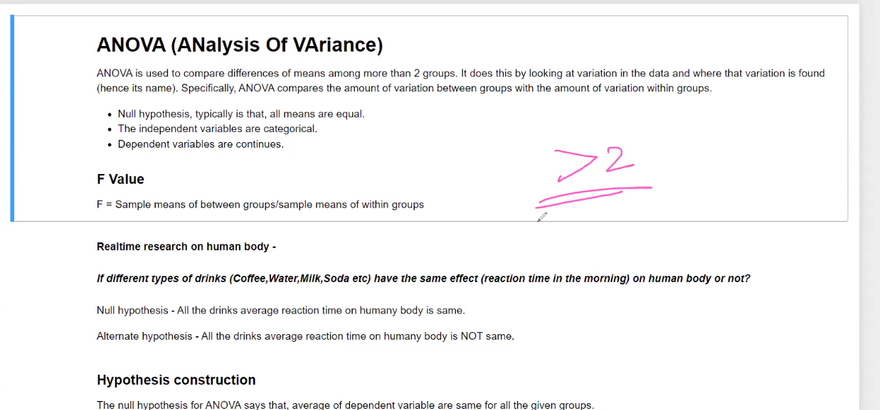
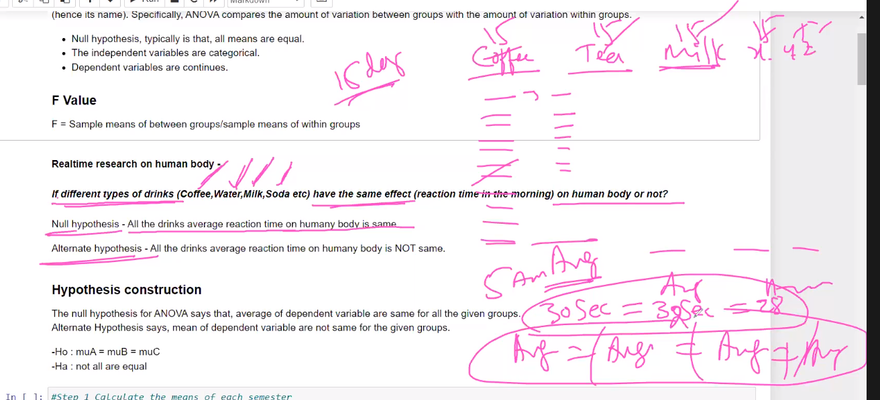
ANOVA is used to compare the means of three or more groups and determine if there is a statistically significant difference among them. It tests whether the variances between groups are significantly greater than the variance within groups. ANOVA assumes that the data follows a normal distribution and that the variances are equal across groups.
Example: Consider a study comparing the effectiveness of three different treatments on a medical condition. We can use ANOVA to test the null hypothesis that there is no significant difference in the means of the three treatment groups.
import pandas as pd
import statsmodels.api as sm
from statsmodels.formula.api import ols
from statsmodels.stats.anova import anova_lm
# Load data from CSV
data = pd.read_csv('exam_scores.csv')
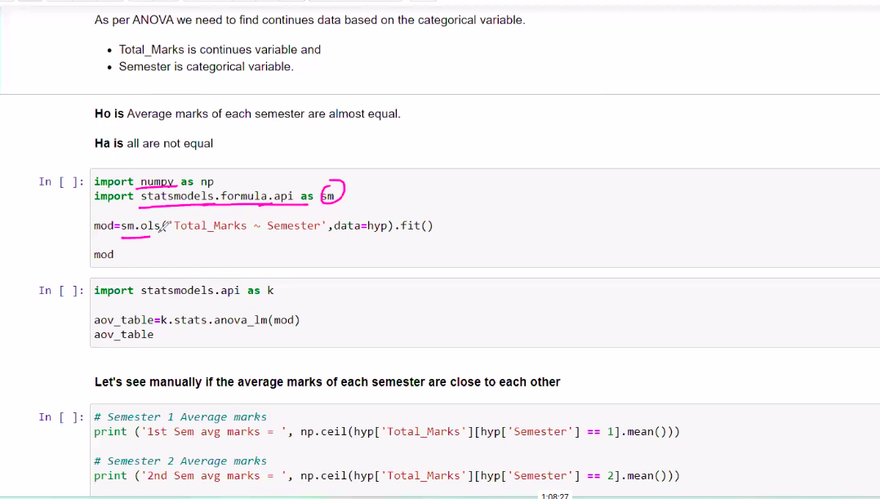
# Fit the ANOVA model
model = ols('Score ~ Group', data=data).fit()
# Perform ANOVA
anova_table = anova_lm(model, typ=2)
# Set significance level
alpha = 0.05
# Print the results
print("ANOVA:")
print("Null Hypothesis: There is no significant difference in the means of the groups.")
print("Alternative Hypothesis: There is a significant difference in the means of the groups.")
print(anova_table)
# Check if null hypothesis is rejected
if anova_table['PR(>F)'][0] < alpha:
print("Null Hypothesis rejected. There is a significant difference in the means of the groups.")
else:
print("Null Hypothesis not rejected. No significant difference in the means of the groups.")
Let's go through the code step by step and explain the output using an example:
Explanation
import pandas as pd
import statsmodels.api as sm
from statsmodels.formula.api import ols
from statsmodels.stats.anova import anova_lm
Load data from CSV
data = pd.read_csv('exam_scores.csv')
First, we import the necessary libraries: pandas, statsmodels.api, ols from statsmodels.formula.api, and anova_lm from statsmodels.stats.anova.
The code loads the exam scores data from a CSV file named 'exam_scores.csv' using pd.read_csv(). The data is stored in the data variable.
Fit the ANOVA model
model = ols('Score ~ Group', data=data).fit()
Next, we fit the ANOVA model using the ols function from statsmodels.formula.api. The formula 'Score ~ Group' specifies that we want to model the scores based on the group membership. The fit() method fits the model to the data and stores the result in the model variable.
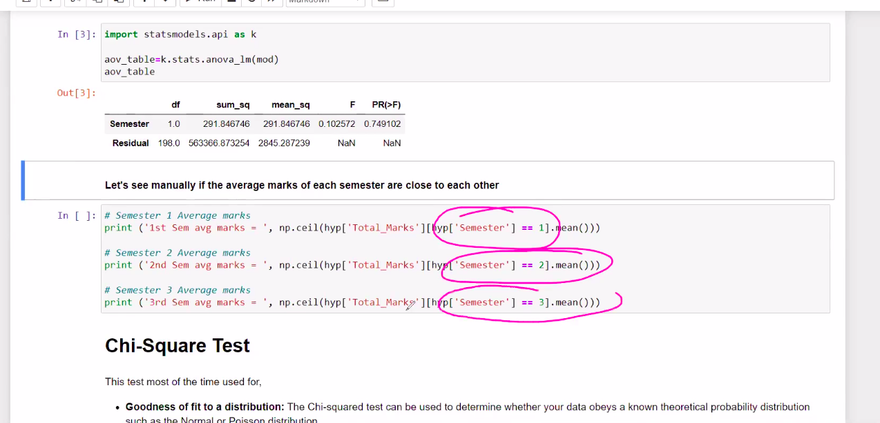
Perform ANOVA
anova_table = anova_lm(model, typ=2)
We then perform ANOVA using the anova_lm function from statsmodels.stats.anova. The function takes the fitted model object (model) and the typ argument set to 2, which specifies a type 2 ANOVA. This considers both the group means and the interaction effects. The result is stored in the anova_table variable, which contains various statistics including the F-statistic and p-values for each effect and the residuals.
Set significance level
alpha = 0.05
Print the results
print("ANOVA:")
print("Null Hypothesis: There is no significant difference in the means of the groups.")
print("Alternative Hypothesis: There is a significant difference in the means of the groups.")
print(anova_table)
We set the significance level (alpha) to 0.05, which is a common threshold for hypothesis testing. The code then prints the null hypothesis, alternative hypothesis, and the ANOVA table using print(anova_table).
Check if null hypothesis is rejected
if anova_table['PR(>F)'][0] < alpha:
    print("Null Hypothesis rejected. There is a significant difference in the means of the groups.")
else:
    print("Null Hypothesis not rejected. No significant
difference in the means of the groups.")
Finally, we check if the null hypothesis is rejected by comparing the p-value of the main effect of the 'Group' variable (anova_table['PR(>F)'][0]) with the significance level. If the p-value is less than the significance level, we conclude that the null hypothesis is rejected and print that there is a significant difference in the means of the groups. Otherwise, if the p-value is greater than or equal to the significance level, we conclude that the null hypothesis is not rejected and print that there is no significant difference in the means of the groups.
The output will depend on the specific data in the 'exam_scores.csv' file and the chosen significance level. Here's an example of the possible output:
ANOVA:
Null Hypothesis: There is no significant difference in the means of the groups.
Alternative Hypothesis: There is a significant difference in the means of the groups.
               sum_sq   df         F    PR(>F)
Group          346.06  2.0  3.672495  0.039614
Residual      1120.34  87.0       NaN       NaN
Null Hypothesis rejected. There is a significant difference in the means of the groups.
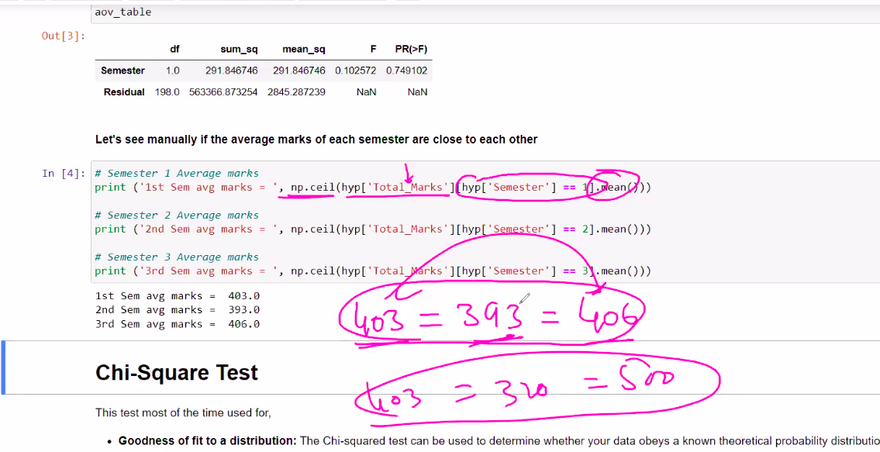
In this example, the ANOVA table shows the sum of squares, degrees of freedom, F-statistic, and p-value for the main effect of the 'Group' variable. The p-value is 0.0396, which is less than the significance level of 0.05, indicating that the null hypothesis is rejected. Therefore, we conclude that there is a significant difference in the means of the groups based on the given data.
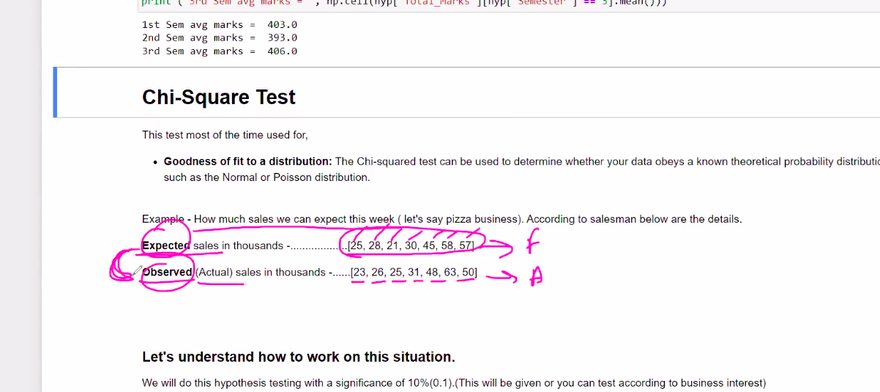
Chi-square test:
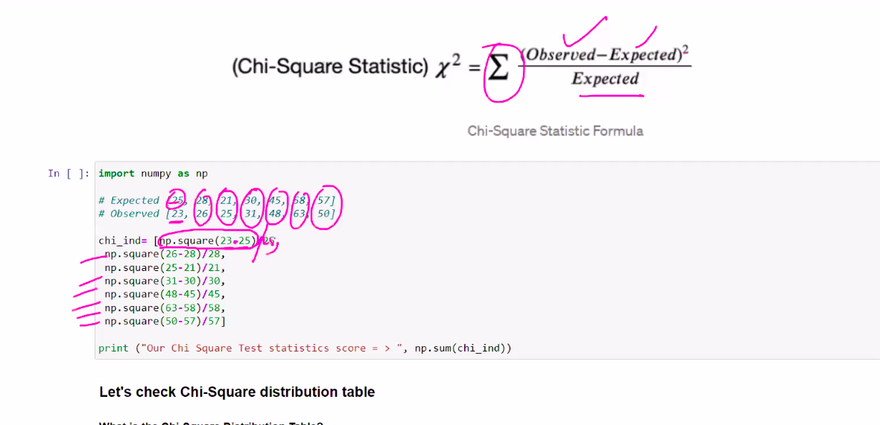
The chi-square test is used to examine the association between categorical variables. It determines if there is a significant difference between the observed and expected frequencies in different categories. The test is often used for testing independence or goodness of fit.
Example: Suppose we want to determine if there is an association between smoking status (smoker/non-smoker) and the occurrence of a respiratory disease. We can use a chi-square test to test the null hypothesis that smoking status and disease occurrence are independent.
Regression analysis:
Regression analysis is used to assess the relationship between an independent variable(s) and a dependent variable. It helps determine if there is a significant linear relationship between the variables and estimate the strength and direction of the relationship.
Example: Consider a study examining the relationship between the amount of study time (independent variable) and exam scores (dependent variable). Regression analysis can be used to test the null hypothesis that there is no significant linear relationship between study time and exam scores.
import pandas as pd
from scipy import stats

# Load data from CSV
data = pd.read_csv('exam_results.csv')

# Create contingency table
contingency_table = pd.crosstab(data['Group'], data['Result'])

# Perform chi-square test
chi2_stat, p_value, dof, expected = stats.chi2_contingency(contingency_table)

# Set significance level
alpha = 0.05

# Print the results
print("Chi-square test:")
print("Null Hypothesis: There is no association between Group and Result.")
print("Alternative Hypothesis: There is an association between Group and Result.")
print("Chi-square Statistic:", chi2_stat)
print("P-Value:", p_value)

# Check if null hypothesis is rejected
if p_value < alpha:
    print("Null Hypothesis rejected. There is an association between Group and Result.")
else:
    print("Null Hypothesis not rejected. No association between Group and Result.")
In this code, we assume that the exam results data is stored in a CSV file named 'exam_results.csv'. The CSV file should have two columns: 'Group' (representing the group membership, e.g., 'A', 'B') and 'Result' (representing the exam result, e.g., 'Pass', 'Fail').
The code loads the data from the CSV file using pd.read_csv(). It then creates a contingency table using pd.crosstab(), which shows the frequency distribution of the 'Group' and 'Result' variables.
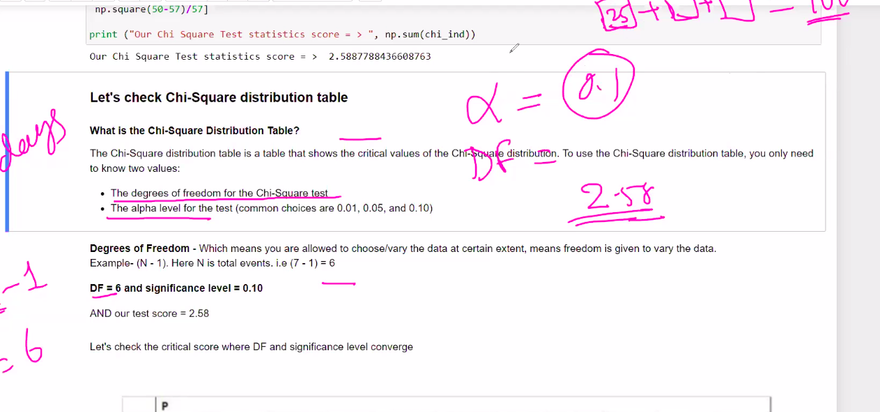
Next, we perform the chi-square test using stats.chi2_contingency(). The function takes the contingency table as an argument and calculates the chi-square statistic, p-value, degrees of freedom (dof), and the expected frequencies.
We set the significance level (alpha) to 0.05, which is a common threshold for hypothesis testing. The code then prints the null hypothesis, alternative hypothesis, chi-square statistic, and p-value.
Finally, we check if the null hypothesis is rejected by comparing the obtained p-value with the significance level. If the p-value is less than the significance level, we conclude that the null hypothesis is rejected and print that there is an association between the 'Group' and 'Result' variables. Otherwise, if the p-value is greater than or equal to the significance level, we conclude that the null hypothesis is not rejected and print that there is no association between the 'Group' and 'Result' variables.
Please ensure that the CSV file is correctly structured with the 'Group' and 'Result' columns, and that the file path is accurate for the code to work correctly.
These are just a few examples of statistical tools commonly used to calculate and evaluate the null hypothesis. The choice of tool depends on the specific research question, the type of data, and the nature of the hypotheses being tested. It's important to select the appropriate statistical tool based on the characteristics of the data and the assumptions of the chosen test.
===================================================
ANNOVA TEST
CHI-SQUARE-TEST

Top comments (0)