Definition of Figure
Create a multiple figure and each figure contain elements of plot using oops approach
Creating a Figure with Grids of Subplots using oops approach
Definition of Figure
a Figure is a top-level container that holds all the elements of a plot or visualization. It is an overall window or canvas that contains various components like axes, labels, titles, legends, colorbars, and other elements.
The Figure() class in Matplotlib is a top-level artist that acts as the primary container for all plot elements. It holds everything together, including subplots, axes, titles, legends, and other artistic elements.
Create a multiple figure and each figure contain elements of plot using oops approach
This example demonstrates how to create multiple figures separately within a single script in Matplotlib.
from matplotlib import pyplot as plt
plt.rcParams["figure.figsize"] = [7, 3.50]
plt.rcParams["figure.autolayout"] = True
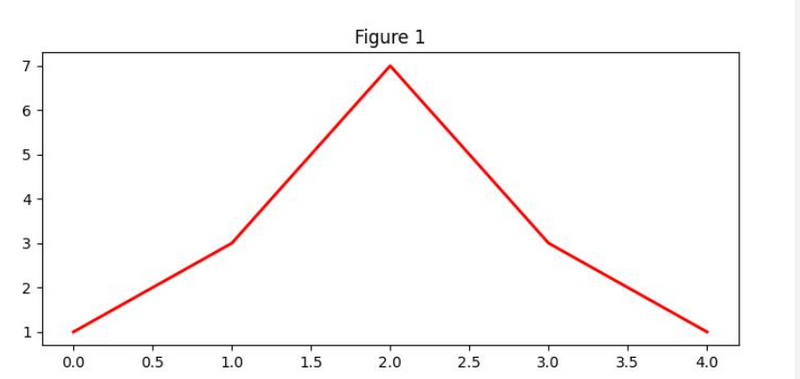
# Create Figure 1
fig1 = plt.figure("Figure 1")
plt.plot([1, 3, 7, 3, 1], c="red", lw=2)
plt.title("Figure 1")
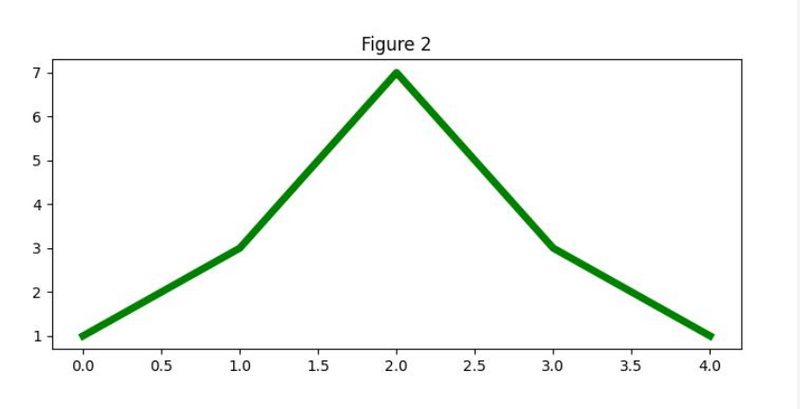
# Create Figure 2
fig2 = plt.figure("Figure 2")
plt.plot([1, 3, 7, 3, 1], c="green", lw=5)
plt.title("Figure 2")
# Display both figures
plt.show()
Output
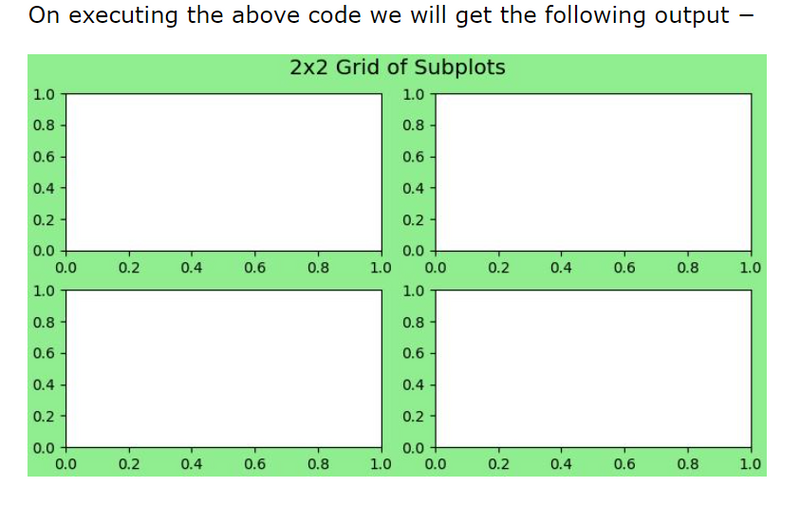
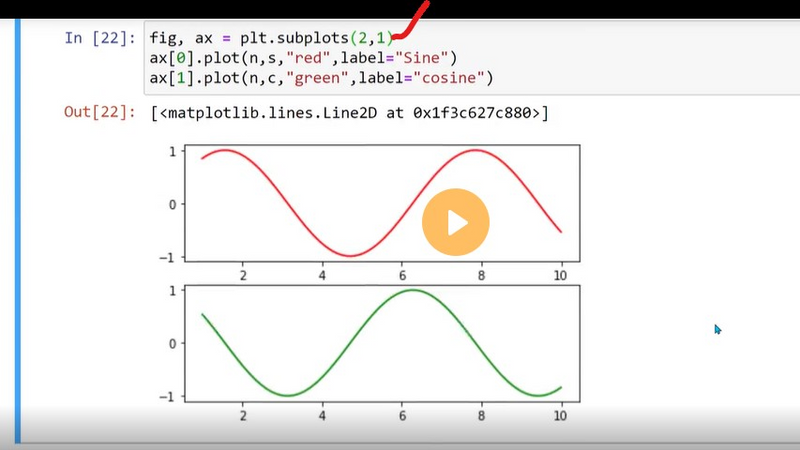
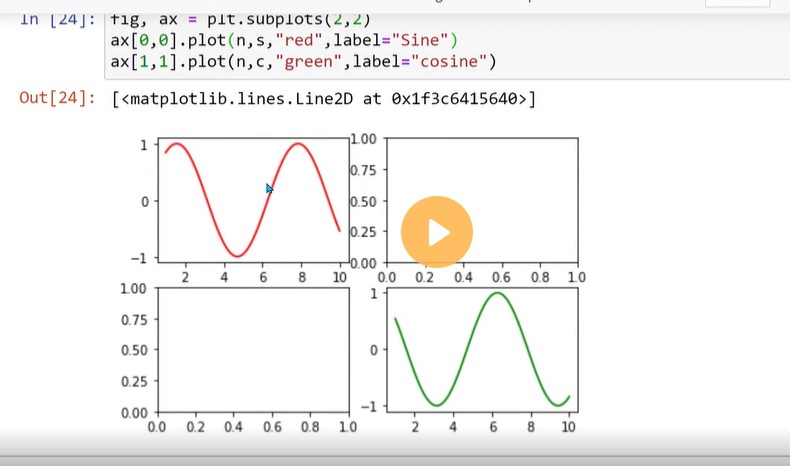
Creating a Figure with Grids of Subplots using oops approach
import matplotlib.pyplot as plt
import numpy as np

# Create a 2x2 grid of subplots with various customization options
fig, axs = plt.subplots(2, 2, figsize=(7, 4), facecolor='lightgreen',
   layout='constrained')

# Super title for the entire figure
fig.suptitle('2x2 Grid of Subplots', fontsize='x-large')

# Display the Figure
plt.show()

import matplotlib.pyplot as plt

# Create a more complex layout using plt.subplot_mosaic()
fig, axs = plt.subplot_mosaic([['A', 'right'], ['B', 'right']],
   facecolor='lightgreen',
   layout='constrained')

# Add text to each subplot
for ax_name, ax in axs.items():
   ax.text(0.5, 0.5, ax_name, ha='center', va='center',
   fontsize='large', fontweight='bold', color='blue')

# Super title for the entire figure
fig.suptitle('Complex Layout using subplot_mosaic()', fontsize='x-large')

# Display the Figure
plt.show()
output
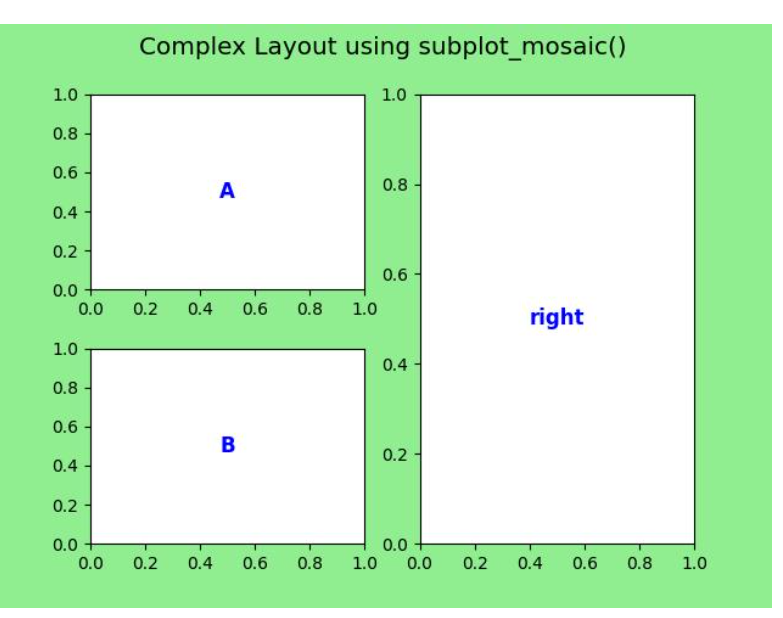
On executing the above code you will get the following output −
Step 1: Install Matplotlib and Django
Ensure that Matplotlib and Django are installed in your Django environment. You can install them using pip:
pip install matplotlib
pip install django
Step 2: Set up your Django project and app
Create a new Django project and an app within the project if you haven't already done so. You can use the following command to create a new app:
django-admin startapp myapp
Step 3: Create a model for the plot in your app
In your app's models.py file, define a model that includes fields to store the plot image and associated data. For example:
from django.db import models

class Plot(models.Model):
    image = models.ImageField(upload_to='plots/')
    title = models.CharField(max_length=100)
    # Add additional fields as needed
Step 4: Generate the Figure and Axes, and save them in the database
In your Django view or script, import the necessary libraries and create a function to generate the Figure and Axes. Use the savefig() function to save the plot as an image file, and then save the plot and associated data in the database.
import matplotlib.pyplot as plt
from myapp.models import Plot
def generate_plot():
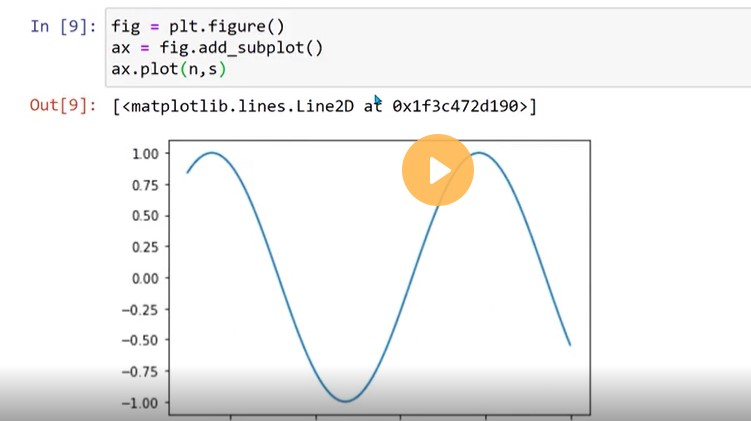
fig = plt.figure()
ax = fig.add_subplot(111)
x = [1, 2, 3, 4, 5]
y = [1, 4, 9, 16, 25]
ax.plot(x, y)
ax.set_title('Figure and Axes')
ax.set_xlabel('X-axis')
ax.set_ylabel('Y-axis')
ax.grid(True)
# Save the plot as an image file
image_path = 'path/to/save/plot.png'
plt.savefig(image_path)
# Save the plot and associated data in the database
plot = Plot.objects.create(
image=image_path,
title='Figure and Axes'
)
Step 5: Render the plot in a Django template
In your Django view, retrieve the plot and associated data from the database and pass them to the template context. Then, render the template with the plot and data.
from django.shortcuts import render
from myapp.models import Plot

def plot_view(request):
    plot = Plot.objects.first()  # Retrieve the plot from the database

    context = {'plot': plot}
    return render(request, 'myapp/plot_template.html', context)
Step 6: Create a template for displaying the plot
Create a template file named plot_template.html in your app's template directory. In the template, use the plot object to access the image URL and display it along with the associated data.
<html>
<head>
    <title>Plot Template</title>
</head>
<body>
    <h1>{{ plot.title }}</h1>
    <img src="{{ plot.image.url }}" alt="{{ plot.title }} Plot">
</body>
</html>
Step 7: Configure media settings in Django
In your project's settings.py file, configure the media settings to specify the location where plot images will be saved.
MEDIA_URL = '/media/'
MEDIA_ROOT = os.path.join(BASE_DIR, 'media')
Step 8: Include media URLs in your project's URLs
In your project's urls.py file, include the media URLs to serve the plot images.
from django.conf import settings
from django.conf.urls.static import static

urlpatterns = [
    # ... your other URL patterns ...
] + static(settings.MEDIA_URL, document_root=settings.MEDIA_ROOT)
Step 9: Run the Django development server
Start the Django development server and visit the URL associated with the plot_view in your web browser. You should see the rendered plot along with the associated data.
python manage.py runserver
That's it! You have now generated a Figure and Axes using Matplotlib, saved it in the database along with associated data, and rendered it in a Django template. The plot image and data are stored in the media directory and can be accessed via the template. Customize the plot and template further as per your requirements.
Summary
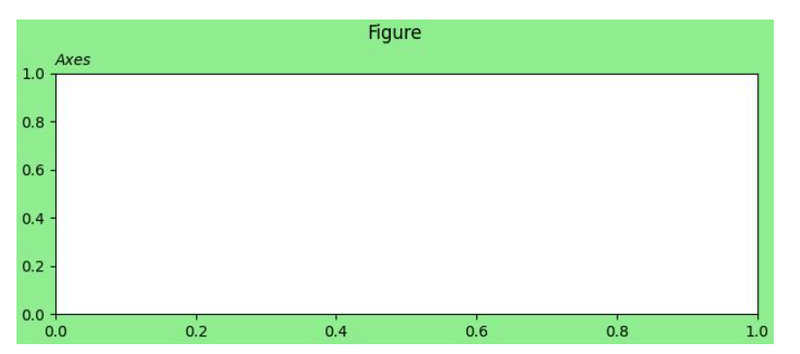
fig = plt.figure(figsize=[7, 3], facecolor='lightgreen', layout='constrained')
fig.suptitle('Figure')
ax = fig.add_subplot()
ax.set_title('Axes', loc='left', fontstyle='oblique', fontsize='medium')
plt.plot([1, 3, 7, 3, 1], c="red", lw=2)
fig, axs = plt.subplots(2, 2, figsize=(7, 4), facecolor='lightgreen',
   layout='constrained')
commands
plt.plot==>c,lw
fig, axs==>figsize,facecolor,layout

Top comments (0)