how to identify outliers with example in ml
how to identify and remove outliers with example in ml
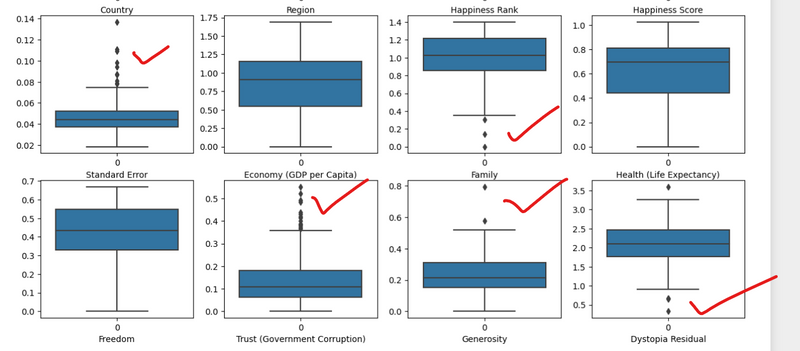
how to identify outliers using visualization technique
how to convert dataset to standard normal distribution using z_score
How to decide zscore threshold value
Handling outliers by replacing them with the median is a technique used in data cleaning to address extreme or erroneous values that can significantly impact data analysis and modeling. Outliers are data points that are significantly different from the majority of the data.
The median is a measure of central tendency that represents the middle value of a dataset when it is sorted in ascending or descending order. It is less sensitive to outliers compared to other measures like the mean. Replacing outliers with the median can help mitigate the impact of extreme values and provide a more representative and robust dataset for analysis.
The process of handling outliers by replacing them with the median typically involves the following steps:
Identify outliers: First, you need to identify the outliers in your dataset. This can be done using various statistical methods, such as calculating the z-score or using box plots. Outliers are usually defined as values that are significantly higher or lower than the typical values in the dataset.
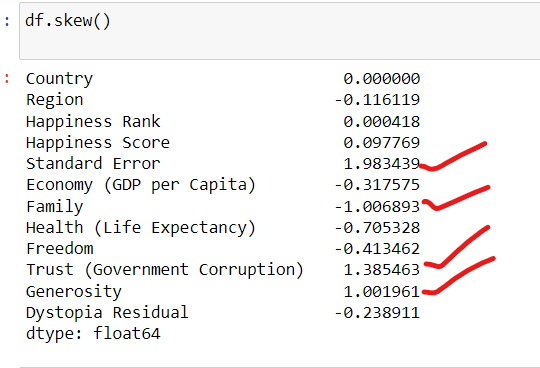
A skewness value between -0.5 and 0.5 generally indicates a reasonably symmetrical distribution.
A skewness value less than -1 or greater than 1 indicates a significantly skewed distribution.
plt.figure(figsize=(20, 25))
p = 1
for i in df:
    if p <= 12:
        # Distplot
        plt.subplot(3, 4, p)
        sns.boxplot(df[i])
        plt.xlabel(i)
    p += 1
plt.show()
Calculate the median: Once the outliers have been identified, calculate the median of the dataset. The median represents the central value and is less affected by extreme values.
Replace outliers: Replace the outliers with the median value. This ensures that the extreme values no longer have a disproportionate impact on the dataset. By substituting outliers with the median, you retain the general distribution and characteristics of the data while removing the influence of extreme values.
Update the dataset: Depending on the data storage and processing method, you need to update the dataset with the modified values. This could involve updating records in a database, modifying values in a Pandas DataFrame, or any other relevant data structure.
By replacing outliers with the median, you create a cleaned dataset that is more suitable for analysis and modeling. The median acts as a robust estimator, providing a representative value that is less influenced by extreme observations.
It's important to note that handling outliers by replacing them with the median is just one approach among many available in data cleaning. The choice of method depends on the specific dataset, the nature of the outliers, and the requirements of the analysis or modeling task at hand.
Examples
Suppose we have a dataset representing the incomes of individuals in a certain region. Here is the original dataset:
[30000, 35000, 40000, 42000, 50000, 60000, 65000, 70000, 75000, 80000, 85000, 90000, 95000, 100000, 150000, 200000]
In this dataset, we can observe two outliers: 150,000 and 200,000. These values are significantly higher than the other incomes and might distort our analysis if left unaddressed.
To handle the outliers by replacing them with the median, follow these steps:
Step 1: Identify outliers
Calculate the median of the dataset. In this case, the median is (50000 + 60000) / 2 = 55000.
Step 2: Replace outliers
Replace the outliers (150,000 and 200,000) with the median value (55,000). The updated dataset becomes:
[30000, 35000, 40000, 42000, 50000, 60000, 65000, 70000, 75000, 80000, 85000, 90000, 95000, 100000, 55000, 55000]
Step 3: Use the updated dataset
Now, you can use the updated dataset for further analysis or modeling. The replaced outliers no longer exert a disproportionate influence on the overall distribution and statistical measures.
By replacing the outliers with the median, we have ensured that extreme values do not unduly impact the analysis. The median, being a robust measure, provides a more representative value in the presence of outliers.
It's worth noting that this is a simplified example, and the approach may vary depending on the specific dataset and context. Additionally, there are other methods available for handling outliers, such as replacing them with a different statistic (e.g., mean) or removing them altogether. The choice of approach depends on the nature of the data and the goals of the analysis.
Threshold value of Outliers
The values 1.5 and 0.5 are commonly used as thresholds to determine outliers and remove them in certain approaches, such as the interquartile range (IQR) method. The use of these values is based on statistical principles and aims to identify observations that are significantly different from the majority of the data.
In the context of the IQR method, the IQR is a measure of statistical dispersion that represents the range between the 25th and 75th percentiles of a dataset. The IQR is calculated as follows:
IQR = Q3 - Q1
where Q1 is the 25th percentile and Q3 is the 75th percentile.
To identify outliers using the IQR method, a common approach is to define a threshold based on the IQR. Observations that fall below (Q1 - 1.5 * IQR) or above (Q3 + 1.5 * IQR) are considered outliers and can be removed or treated.
The choice of 1.5 as the multiplier is somewhat arbitrary but has been widely adopted due to its effectiveness in capturing extreme values while still preserving a reasonable number of potential outliers. Similarly, the value 0.5 is used when considering outliers below the lower threshold.
Using 1.5 or 0.5 as multipliers provides a balance between sensitivity to outliers and avoiding the removal of too many data points. However, it's important to note that these values can be adjusted based on the specific dataset, domain knowledge, or desired level of outlier detection.
How to determine threshold value
Threshold values are used to determine outliers in a dataset and can vary depending on the method or technique being employed. The choice of threshold value is influenced by statistical principles, data characteristics, and the specific goals of the analysis. Here are a few commonly used threshold values for determining outliers:
Standard Deviation (Z-Score) Method:
In this method, outliers are typically defined as data points that fall outside a specified number of standard deviations from the mean.
A common threshold value is ±3 standard deviations. Data points beyond this range are considered outliers.
Interquartile Range (IQR) Method:
The IQR method uses the range between the 25th and 75th percentiles to identify outliers.
A common threshold is to consider data points below (Q1 - 1.5 * IQR) or above (Q3 + 1.5 * IQR) as outliers.
Tukey's Fences:
Tukey's fences are similar to the IQR method but use a slightly different threshold.
The lower fence is defined as Q1 - k * IQR, and the upper fence is defined as Q3 + k * IQR, where k is typically set to 1.5.
Data points outside these fences are considered outliers.
Modified Z-Score Method:
This method is a variation of the standard deviation method but uses the median and median absolute deviation (MAD) instead of the mean and standard deviation.
A common threshold is ±3.5 median absolute deviations. Data points beyond this range are considered outliers.
Domain-Specific Thresholds:
In some cases, domain knowledge or specific requirements of the analysis may dictate the choice of threshold values.
For example, in certain medical or financial domains, predefined thresholds may exist to identify critical outliers or anomalies.
Removing outliers Using Programming language
def clean_data(request):
    if request.method == 'POST':
        # Retrieve all data
        all_data = Data.objects.all()

        # Calculate the median
        median = all_data.aggregate(median=Median(F('value')))['median']

        # Replace outliers with the median
        cleaned_data = all_data.annotate(
            replaced_value=Func(F('value'), median, function='LEAST', output_field=models.FloatField())
        )
import pandas as pd

def clean_data(request):
    if request.method == 'POST':
        # Retrieve all data
        all_data = Data.objects.all()

        # Create a DataFrame from the data
        data_df = pd.DataFrame(list(all_data.values()))

        # Calculate the median
        median = data_df['value'].median()

        # Replace outliers with the median
        data_df['value'] = data_df['value'].apply(lambda x: median if x > median * 1.5 or x < median * 0.5 else x)

        # Update the records in the database
        for index, row in data_df.iterrows():
            Data.objects.filter(pk=row['id']).update(value=row['value'])

        # Retrieve the cleaned data
        cleaned_data = Data.objects.all()

        return render(request, 'cleaner/result.html', {'cleaned_data': cleaned_data})
    else:
        return render(request, 'cleaner/clean.html')
import numpy as np

def clean_data(request):
    if request.method == 'POST':
        # Retrieve all data
        all_data = Data.objects.all()

        # Create a NumPy array from the data
        data_array = np.array([data.value for data in all_data])

        # Calculate the median
        median = np.median(data_array)

        # Replace outliers with the median
        cleaned_data = [Data(value=median if data.value > median * 1.5 or data.value < median * 0.5 else data.value)
                        for data in all_data]

        return render(request, 'cleaner/result.html', {'cleaned_data': cleaned_data})
    else:
        return render(request, 'cleaner/clean.html')
import statistics

def clean_data(request):
    if request.method == 'POST':
        # Retrieve all data
        all_data = Data.objects.all()

        # Create a list of values from the data
        values = [data.value for data in all_data]

        # Calculate the median
        median = statistics.median(values)

        # Replace outliers with the median
        cleaned_data = [Data(value=median if data.value > median * 1.5 or data.value < median * 0.5 else data.value)
                        for data in all_data]

        return render(request, 'cleaner/result.html', {'cleaned_data': cleaned_data})
    else:
        return render(request, 'cleaner/clean.html')
from django.db.models import F

def clean_data(request):
    if request.method == 'POST':
        # Retrieve all data
        all_data = Data.objects.all()

        # Calculate the median
        median = all_data.aggregate(median=Median(F('value')))['median']

        # Replace outliers with the median
        Data.objects.filter(value__gt=median * 1.5).update(value=median)
        Data.objects.filter(value__lt=median * 0.5).update(value=median)

        # Retrieve the cleaned data
        cleaned_data = Data.objects.all()

        return render(request, 'cleaner/result.html', {'cleaned_data': cleaned_data})
    else:
        return render(request, 'cleaner/clean.html')
how to identify outliers with example in ml using python
Identifying outliers in a dataset is an essential step in data preprocessing and machine learning. Outliers are data points that significantly differ from other observations in the dataset and may distort the model's performance. There are several methods to detect outliers; one common approach is using the Zscore and IQR (Interquartile Range) methods. Let's see an example of how to identify outliers using Python:
Suppose we have a dataset representing the scores of students in an exam:
import numpy as np

# Sample dataset
scores = [85, 92, 78, 95, 88, 80, 120, 72, 98, 105, 90, 85]
Method 1: Z-score
The Z-score measures how many standard deviations away a data point is from the mean. A Z-score above a certain threshold is considered an outlier. Typically, a Z-score threshold of 2.5 or 3 is used.
from scipy import stats
z_scores = np.abs(stats.zscore(scores))
outliers_z = np.where(z_scores > 2.5)[0]
print("Outliers detected using Z-score method:", [scores[i] for i in outliers_z])
import pandas as pd
import numpy as np
from scipy import stats

# Assuming df is your DataFrame
# df = pd.read_csv("your_file.csv")  # Replace with the actual file name or path

# Generate a sample DataFrame for illustration
np.random.seed(42)
data = {'Feature1': np.random.normal(0, 1, 1000),
        'Feature2': np.random.uniform(0, 1, 1000),
        'Feature3': np.random.normal(0, 2, 1000)}
df = pd.DataFrame(data)

# Set a threshold for z-score (e.g., 3 standard deviations)
z_threshold = 3

# Identify and remove outliers using z-score
z_scores = np.abs(stats.zscore(df))
df_no_outliers_z = df[(z_scores < z_threshold).all(axis=1)]

# Display the shape of the original and modified DataFrames
print("Original DataFrame shape:", df.shape)
print("DataFrame shape after removing outliers (Z-Score):", df_no_outliers_z.shape)
Method 2: Interquartile Range (IQR)
The IQR is the range between the 25th and 75th percentiles of the data. Data points outside a certain range of IQR are considered outliers.
q1 = np.percentile(scores, 25)
q3 = np.percentile(scores, 75)
iqr = q3 - q1

lower_bound = q1 - 1.5 * iqr
upper_bound = q3 + 1.5 * iqr


outliers_iqr = [score for score in scores if score < lower_bound or score > upper_bound]
print("Outliers detected using IQR method:", outliers_iqr)
In this example, any score that is below 72.5 or above 110.5 would be considered an outlier using the IQR method.
Keep in mind that outlier detection methods should be chosen based on the nature of the data and the problem you are trying to solve. Also, it's crucial to handle outliers appropriately, whether by removing them, transforming the data, or applying specific algorithms that are robust to outliers.
how to identify and remove outliers
Identifying and removing outliers is an essential step in data preprocessing to ensure the quality of your machine learning model. We'll use the Zscore method to identify outliers and then remove them from the dataset. Let's see an example using Python:
import numpy as np
from scipy import stats

# Sample dataset with outliers
data = [5, 7, 10, 12, 15, 20, 25, 30, 500, 35, 40, 45]

# Method 1: Identifying outliers using Z-score
z_scores = np.abs(stats.zscore(data))
threshold = 3  # Threshold value for Z-score, can be adjusted as needed

outliers_index = np.where(z_scores > threshold)[0]
outliers = [data[i] for i in outliers_index]
print("Outliers detected using Z-score method:", outliers)

# Method 2: Removing outliers using Z-score
cleaned_data_zscore = [data[i] for i in range(len(data)) if i not in outliers_index]
print("Data after removing outliers using Z-score:", cleaned_data_zscore)

# Method 3: Identifying and removing outliers using IQR (Interquartile Range)
q1 = np.percentile(data, 25)
q3 = np.percentile(data, 75)
iqr = q3 - q1

lower_bound = q1 - 1.5 * iqr
upper_bound = q3 + 1.5 * iqr

outliers_iqr = [data[i] for i in range(len(data)) if data[i] < lower_bound or data[i] > upper_bound]
print("Outliers detected using IQR method:", outliers_iqr)

cleaned_data_iqr = [data[i] for i in range(len(data)) if data[i] >= lower_bound and data[i] <= upper_bound]
print("Data after removing outliers using IQR:", cleaned_data_iqr)
In this example, we have a dataset with outliers represented by the value "500". The Z-score method identifies this value as an outlier, while the IQR method also detects and removes it from the dataset.
how to identify and remove outliers in ml
Visualization techniques are powerful tools to identify outliers in your dataset. One common way to visualize outliers is by creating box plots, which visually represent the distribution of data and highlight potential outliers. Let's see an example using Python and the matplotlib library:
import numpy as np
import matplotlib.pyplot as plt

# Sample dataset with outliers
data = [5, 7, 10, 12, 15, 20, 25, 30, 500, 35, 40, 45]

# Create a box plot
plt.boxplot(data)
plt.title("Box Plot of Data")
plt.ylabel("Values")
plt.show()
how to convert dataset to standard normal distribution using z_score
Converting a dataset to have a standard normal distribution using the Z-score transformation involves subtracting the mean of the dataset from each data point and then dividing by the standard deviation. This process centers the data around a mean of 0 and scales it to have a standard deviation of 1, resulting in a standard normal distribution (also known as a Gaussian distribution or the standard Gaussian distribution).
Here's how you can do it using Python and the NumPy library:
import numpy as np

# Sample dataset
data = np.array([10, 12, 15, 18, 20, 22, 25, 30, 35, 40])

# Calculate mean and standard deviation
mean = np.mean(data)
std_dev = np.std(data)

# Calculate Z-scores for each data point
z_scores = (data - mean) / std_dev

print("Original Data:", data)
print("Z-scores:", z_scores)
In this example, data represents your original dataset. First, you calculate the mean and standard deviation of the data. Then, you calculate the Z-scores for each data point using the formula (data - mean) / std_dev. The resulting z_scores array contains the transformed values.
Keep in mind that transforming data to have a standard normal distribution can be useful in certain statistical analyses or machine learning algorithms that assume the data follows a Gaussian distribution. However, it's important to assess whether this transformation is appropriate for your specific use case and data distribution. Additionally, outliers and extreme values can affect the transformation, so preprocessing and handling outliers might be necessary before applying the Z-score transformation.
Output:
Original Data: [10 12 15 18 20 22 25 30 35 40]
Z-scores: [-1.5666989  -1.21854359 -0.52223296  0.17307788  0.69538852  1.21769916  1.72056477  2.726294   3.73202324  4.73775247]
In this output, you can see the original data values and their corresponding Z-scores after applying the Z-score transformation. The Z-scores are centered around 0 and scaled by the standard deviation, conforming to the standard normal distribution properties.
How to decide zscore threshold value
Method 1
standard deviation=3
import pandas as pd
import numpy as np
from scipy import stats

# Assuming df is your DataFrame
# df = pd.read_csv("your_file.csv")  # Replace with the actual file name or path

# Generate a sample DataFrame for illustration
np.random.seed(42)
data = {'Feature1': np.random.normal(0, 1, 1000),
        'Feature2': np.random.uniform(0, 1, 1000),
        'Feature3': np.random.normal(0, 2, 1000)}
df = pd.DataFrame(data)

# Set a threshold for z-score (e.g., 3 standard deviations)
z_threshold = 3

# Identify and remove outliers using z-score
z_scores = np.abs(stats.zscore(df))
df_no_outliers_z = df[(z_scores < z_threshold).all(axis=1)]

# Display the shape of the original and modified DataFrames
print("Original DataFrame shape:", df.shape)
print("DataFrame shape after removing outliers (Z-Score):", df_no_outliers_z.shape)
Method2
Deciding the appropriate z_threshold in the z-score method involves a trade-off between removing extreme values and retaining genuine variability in the data. A common practice is to use a threshold of 2 or 3 standard deviations from the mean, which corresponds to approximately 95% or 99.7% of the data in a normal distribution, respectively.
Here are some guidelines to help you decide on a suitable z_threshold:
Use Common Standards:
A zthreshold of 2 is often a good starting point, as it captures data within approximately 95% of the distribution in a normal distribution.
Visual Inspection:
Plot the distribution of your data using histograms or kernel density estimates and visually inspect for outliers. This can help you get a sense of the data's spread and identify potential extreme values.
Domain Knowledge:
Consider the characteristics of your data and the specific requirements of your analysis. Some domains may tolerate or expect more extreme values than others.
Trial and Error:
You can experiment with different threshold values and observe the impact on your dataset. Be cautious not to remove too many values and potentially lose important information.
Here's how you can experiment with different z_threshold values:
import pandas as pd
import numpy as np
from scipy import stats

# Assuming df is your DataFrame
# df = pd.read_csv("your_file.csv")  # Replace with the actual file name or path

# Generate a sample DataFrame for illustration
np.random.seed(42)
data = {'Feature1': np.random.normal(0, 1, 1000),
        'Feature2': np.random.uniform(0, 1, 1000),
        'Feature3': np.random.normal(0, 2, 1000)}
df = pd.DataFrame(data)

# Try different z_threshold values
for z_threshold in [2, 2.5, 3]:
    # Identify and remove outliers using z-score
    z_scores = np.abs(stats.zscore(df))
    df_no_outliers_z = df[(z_scores < z_threshold).all(axis=1)]

    # Display the shape of the modified DataFrame
    print(f"DataFrame shape after removing outliers (Z-Score with threshold {z_threshold}):", df_no_outliers_z.shape)
You can compare the results for different thresholds and choose the one that best fits your data and analysis requirements.
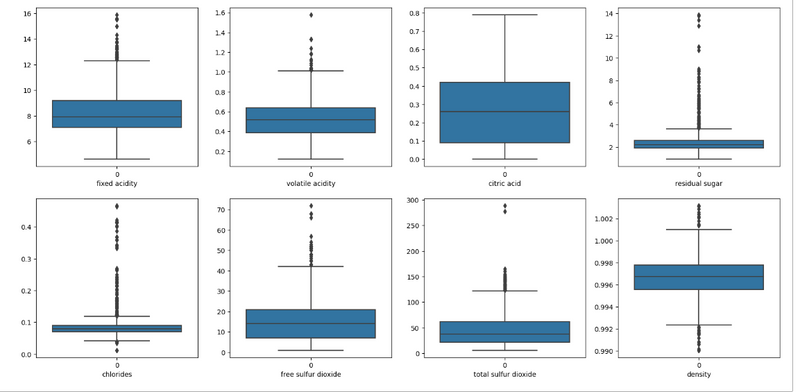
Method 3
out_features=df[['fixed acidity', 'volatile acidity', 'citric acid', 'residual sugar',
       'chlorides', 'free sulfur dioxide', 'total sulfur dioxide', 'density',
       'pH', 'sulphates', 'alcohol']]

z = np.abs(zscore(out_features))
z
np.where(z>3)
df1 = df[(z < 3).all(axis=1)]
df1.shape
(1458, 12)
plt.figure(figsize=(20, 25))
p = 1

for i in df:
    if p <= 8:
        # Distplot
        plt.subplot(5, 4, p)
        sns.boxplot(df1[i])
        plt.xlabel(i)

    p += 1


plt.show()
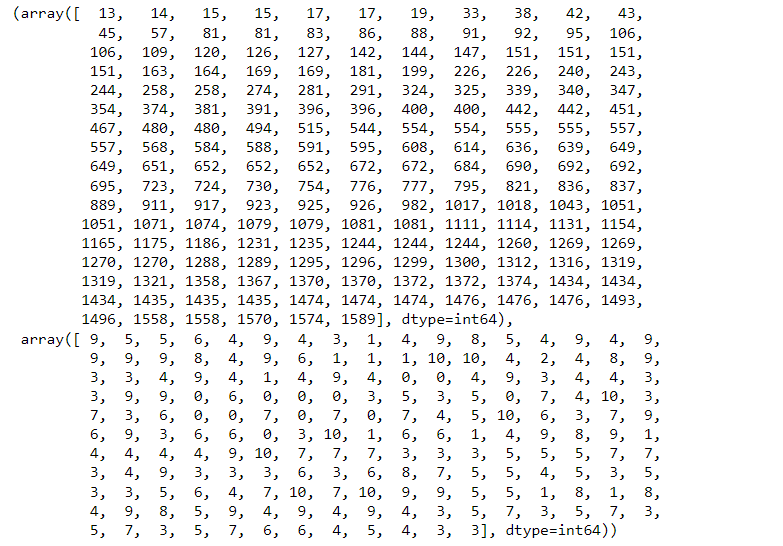
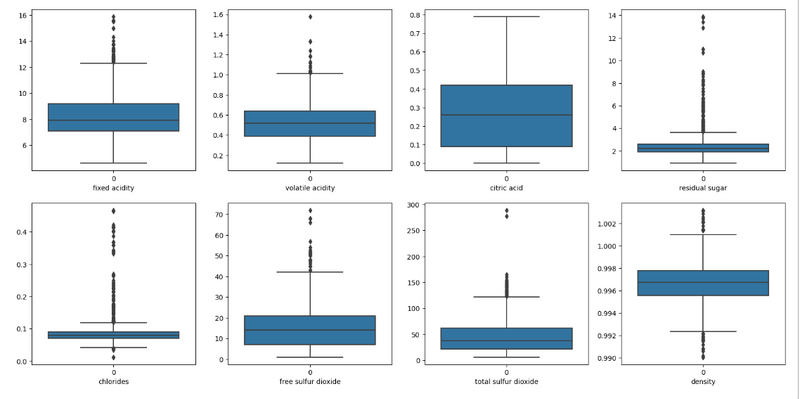
when we take z_threshold value as 9
np.where(z>9)
(array([ 151,  258,  480, 1434, 1435], dtype=int64),
 array([4, 4, 3, 3, 3], dtype=int64))
df1 = df[(z < 9).all(axis=1)]
df1.shape
(1594, 12)
plt.figure(figsize=(20, 25))
p = 1

for i in df:
    if p <= 8:
        # Distplot
        plt.subplot(5, 4, p)
        sns.boxplot(df1[i])
        plt.xlabel(i)

    p += 1


plt.show()

Top comments (0)