Step 1: Install Matplotlib and Django
Ensure that Matplotlib and Django are installed in your Django environment. You can install them using pip:
pip install matplotlib
pip install django
Step 2: Set up your Django project and app
Create a new Django project and an app within the project if you haven't already done so. You can use the following command to create a new app:
django-admin startapp myapp
Step 3: Create a model for the scatter plot in your app
In your app's models.py file, define a model that includes fields to store the scatter plot image and associated data. For example:
from django.db import models

class ScatterPlot(models.Model):
    image = models.ImageField(upload_to='scatter_plots/')
    title = models.CharField(max_length=100)
# Add additional fields as needed
Step 4: Generate and format the scatter plot
In your Django view or script, import the necessary libraries and create a function to generate and format the scatter plot. Use the various options available in Matplotlib to customize the appearance of the scatter plot.
import matplotlib.pyplot as plt
from myapp.models import ScatterPlot

def generate_scatter_plot():
    # Generate data for the scatter plot
    x = [1, 2, 3, 4, 5]
    y = [1, 4, 9, 16, 25]

    # Create a new figure and axes
    fig, ax = plt.subplots()

    # Plot the scatter points
    ax.scatter(x, y)

    # Set the title and axis labels
    ax.set_title('Scatter Plot Title')
    ax.set_xlabel('X-axis')
    ax.set_ylabel('Y-axis')

    # Customize other scatter plot attributes (e.g., marker size, color, transparency)

    # Save the scatter plot as an image file
    image_path = 'path/to/save/scatter_plot.png'
    plt.savefig(image_path)

    # Save the scatter plot and associated data in the database
    scatter_plot = ScatterPlot.objects.create(
        image=image_path,
        title='Scatter Plot'
    )
Step 5: Render the scatter plot in a Django template
In your Django view, retrieve the scatter plot and associated data from the database and pass them to the template context. Then, render the template with the scatter plot and data.
from django.shortcuts import render
from myapp.models import ScatterPlot

def scatter_plot_view(request):
    scatter_plot = ScatterPlot.objects.first()  # Retrieve the scatter plot from the database

    context = {'scatter_plot': scatter_plot}
    return render(request, 'myapp/scatter_plot_template.html', context)
Step 6: Create a template for displaying the scatter plot
Create a template file named scatter_plot_template.html in your app's template directory. In the template, use the scatter_plot object to access the image URL and display the scatter plot along with the associated data.
<!DOCTYPE html>
<html>
<head>
    <title>Scatter Plot Template</title>
</head>
<body>
    <h1>{{ scatter_plot.title }}</h1>
    <img src="{{ scatter_plot.image.url }}" alt="Scatter Plot">
</body>
</html>
Step 7: Configure media settings in Django
In your project's settings.py file, configure the media settings to specify the location where the scatter plot image will be saved.
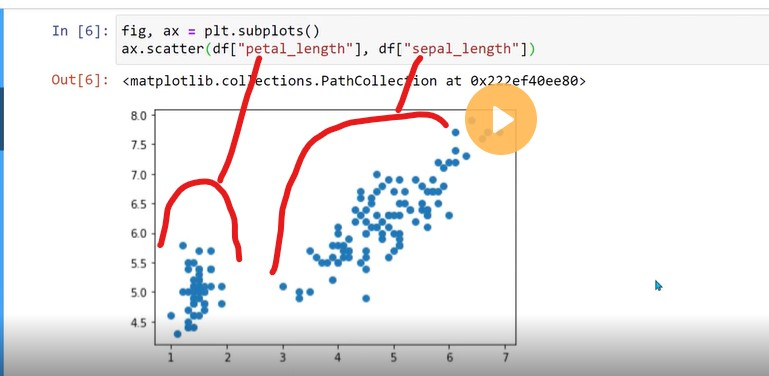
Certainly! Plotting scatter points with 3 or more parameters allows you to visualize data in a higher-dimensional space. Here's an example of how you can plot scatter points with 3 parameters using Matplotlib:
import matplotlib.pyplot as plt
import numpy as np

# Generate random data for three parameters
x = np.random.rand(100)
y = np.random.rand(100)
z = np.random.rand(100)

# Create a new figure and axes
fig = plt.figure()
ax = fig.add_subplot(111, projection='3d')

# Plot the scatter points with three parameters
ax.scatter(x, y, z)

# Set the title and axis labels
ax.set_title('Scatter Plot with Three Parameters')
ax.set_xlabel('X-axis')
ax.set_ylabel('Y-axis')
ax.set_zlabel('Z-axis')

# Show the plot
plt.show()
In the example above, we use the projection='3d' parameter when creating the subplot to specify that we want to create a 3D scatter plot. We generate random data for three parameters x, y, and z, each consisting of 100 data points.
The scatter() function is used to plot the scatter points with three parameters. We pass x, y, and z as arguments to plot the points in the three-dimensional space.
We then set the title and axis labels using the set_title(), set_xlabel(), set_ylabel(), and set_zlabel() functions.
Finally, we display the plot using plt.show().
You can extend this example to include more than three parameters by generating additional data arrays and passing them as arguments to the scatter() function. Each additional parameter would correspond to an additional axis in the plot.
Different attribute to scatter plot
Certainly! Here are some common attributes of the scatter() function in Matplotlib along with examples:
x, y (array-like): The coordinates of the data points to be plotted. These can be arrays, lists, or other iterable objects.
import matplotlib.pyplot as plt
import numpy as np

x = [1, 2, 3, 4, 5]
y = [1, 4, 9, 16, 25]

plt.scatter(x, y)
plt.show()
s (scalar or array-like, optional): The size of the markers. It can be a scalar to define a single size for all markers or an array-like object to specify individual sizes for each marker.
import matplotlib.pyplot as plt
import numpy as np

x = [1, 2, 3, 4, 5]
y = [1, 4, 9, 16, 25]
sizes = [20, 40, 60, 80, 100]

plt.scatter(x, y, s=sizes)
plt.show()
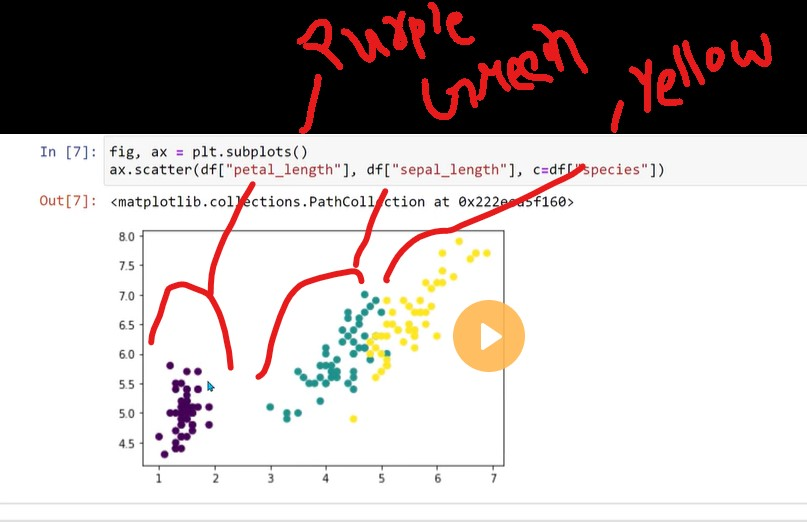
c (color or sequence, optional): The color of the markers. It can be a single color string or a sequence of colors that correspond to each data point.
import matplotlib.pyplot as plt
import numpy as np

x = [1, 2, 3, 4, 5]
y = [1, 4, 9, 16, 25]
colors = ['red', 'green', 'blue', 'orange', 'purple']

plt.scatter(x, y, c=colors)
plt.show()
marker (string, optional): The marker style for the data points. It can be a string representing the marker shape, such as 'o' for circles, 's' for squares, or 'x' for crosses.
import matplotlib.pyplot as plt
import numpy as np

x = [1, 2, 3, 4, 5]
y = [1, 4, 9, 16, 25]

plt.scatter(x, y, marker='s')
plt.show()
alpha (float, optional): The transparency of the markers. It accepts a value between 0 (completely transparent) and 1 (completely opaque).
import matplotlib.pyplot as plt
import numpy as np

x = [1, 2, 3, 4, 5]
y = [1, 4, 9, 16, 25]

plt.scatter(x, y, alpha=0.5)
plt.show()
cmap (Colormap, optional): The colormap used to map numerical values to colors. It can be a predefined colormap or a custom colormap object.
import matplotlib.pyplot as plt
import numpy as np

x = [1, 2, 3, 4, 5]
y = [1, 4, 9, 16, 25]
sizes = [20, 40, 60, 80, 100]
colors = [1, 2, 3, 4, 5]

plt.scatter(x, y, s=sizes, c=colors, cmap='viridis')
plt.colorbar()
plt.show()


Top comments (0)