best-fit line in machine learning--linear regression
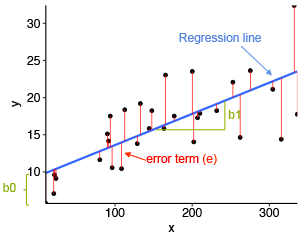
find the line that best fits a given set of data points
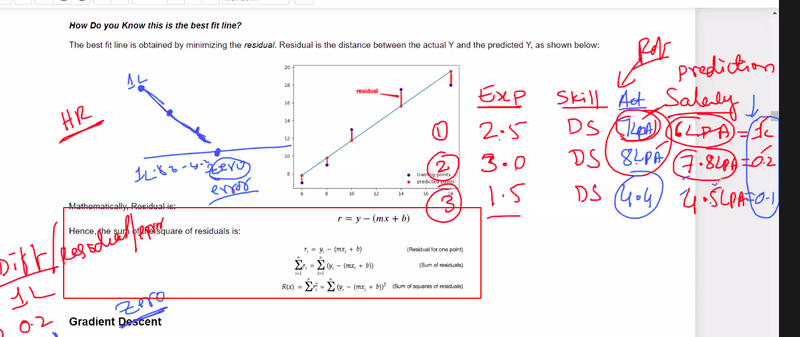
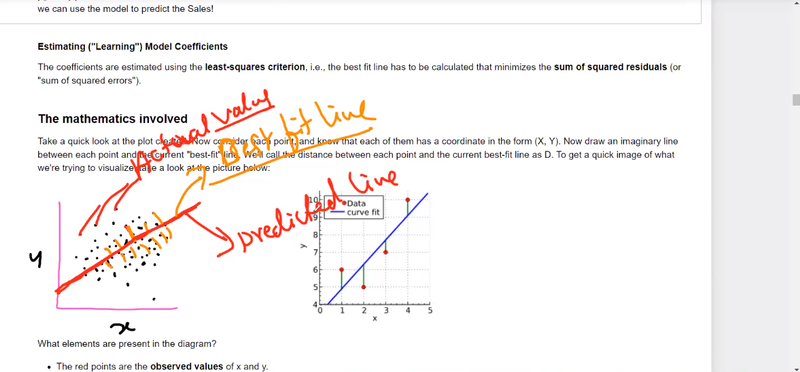
calculate the sum of residuals and the sum of squares of residuals
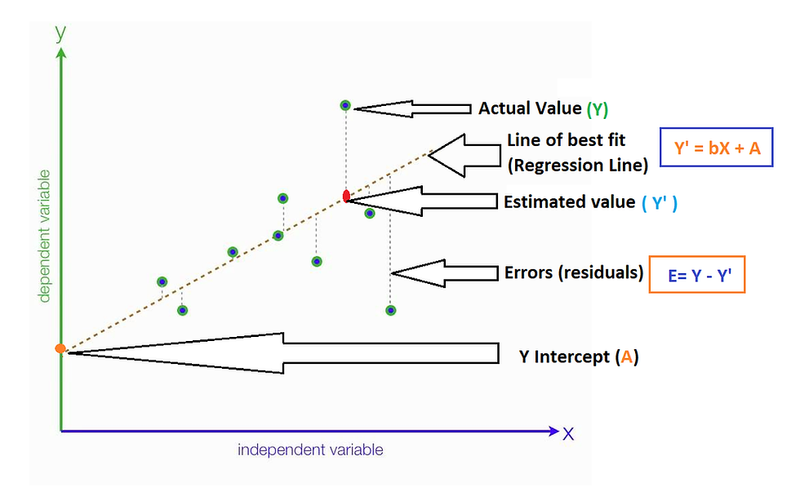
actual value
estimated value best fit line
error residual
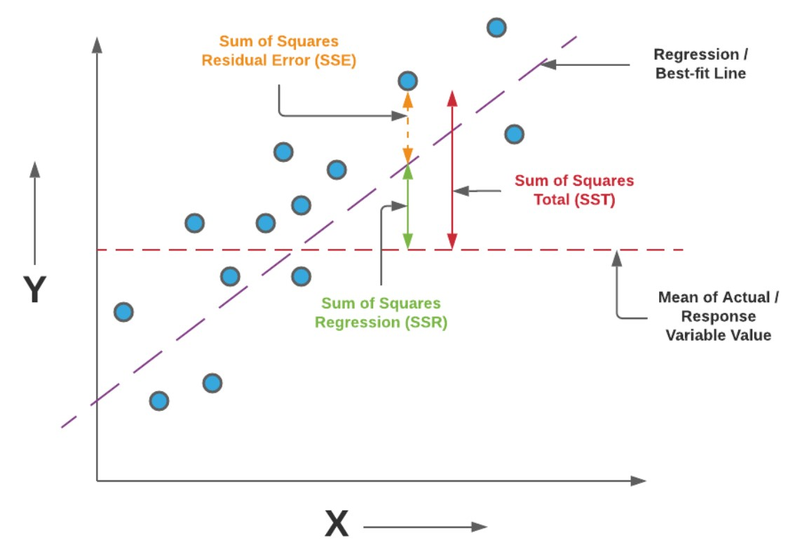
Adjusted R-squared is a statistical-measure of how well the model fits the data
R-squared
To calculate the best-fit line in machine learning, you typically use a method called linear regression. Linear regression aims to find the line that best fits a given set of data points.
Here's an example of how you can calculate the best-fit line using linear regression and calculate the sum of residuals and the sum of squares of residuals:
import numpy as np

# Sample data points
x = np.array([1, 2, 3, 4, 5])  # Independent variable
y = np.array([2, 4, 5, 4, 5])  # Dependent variable

# Calculate the coefficients of the best-fit line
coefficients = np.polyfit(x, y, 1)  # Fit a line of degree 1 (a straight line)
slope, intercept = coefficients

# Calculate the predicted values on the best-fit line
predicted_y = slope * x + intercept

# Calculate the residuals and sum of residuals
residuals = y - predicted_y
sum_residuals = np.sum(residuals)

# Calculate the sum of squares of residuals
sum_squares_residuals = np.sum(residuals ** 2)

print("Best-fit line equation: y =", slope, "* x +", intercept)
print("Sum of residuals:", sum_residuals)
print("Sum of squares of residuals:", sum_squares_residuals)
Output:
Best-fit line equation: y = 0.7 * x + 2.2

Sum of residuals: -0.6

Sum of squares of residuals: 1.88
In this example, the best-fit line equation is y = 0.7 * x + 2.2, which represents the line that best fits the given data points. The sum of residuals is -0.6, indicating the overall difference between the actual y-values and the predicted y-values on the best-fit line. The sum of squares of residuals is 1.88, which measures the overall squared difference between the actual y-values and the predicted y-values.
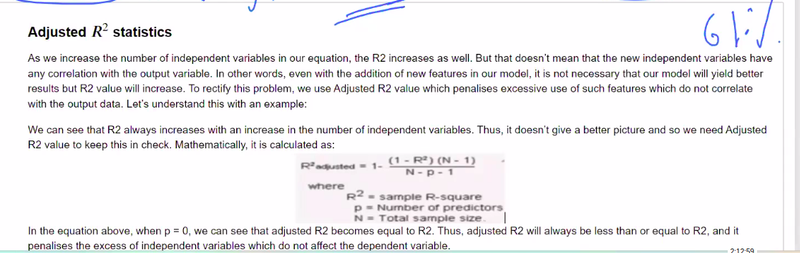
Adjusted R-squared is a statistical measure used to assess the goodness-of-fit of a regression model, particularly when comparing models with different numbers of predictors. It is an adjusted version of the R-squared metric that takes into account the number of predictors in the model.
R-squared, also known as the coefficient of determination, measures the proportion of the variance in the dependent variable that is explained by the independent variables in the regression model. However, R-squared tends to increase as more predictors are added to the model, even if those predictors have little or no effect on the dependent variable. This can lead to overfitting and misleading results.
Adjusted R-squared addresses this issue by penalizing the addition of unnecessary predictors. It adjusts the R-squared value by taking into account the number of predictors and the sample size. The adjusted R-squared value provides a more reliable measure of how well the model fits the data, considering the complexity of the model.
The formula for adjusted R-squared is:
Adjusted R-squared = 1 - (1 - R-squared) * (n - 1) / (n - p - 1)
Where:
R-squared is the original R-squared value
n is the sample size
p is the number of predictors in the model
The adjusted R-squared value ranges from negative infinity to 1. A higher adjusted R-squared value indicates a better fit of the model, accounting for the number of predictors.
To interpret the adjusted R-squared value:
A value close to 1 indicates that a large proportion of the variance in the dependent variable is explained by the independent variables in the model, while considering the number of predictors.
A value close to 0 suggests that the model does not explain much of the variance in the dependent variable or that the model is not an improvement over a simple average.
A negative value may occur if the model is overfitting the data or if it is a poor fit.
In summary, adjusted R-squared is a useful statistic for evaluating the fit of a regression model, accounting for the number of predictors. It helps in comparing models and selecting the best model that balances explanatory power and model complexity.

Top comments (0)