For object detection we use the concept of Intersection over Union (IoU). IoU computes intersection over the union of the two bounding boxes; the bounding box for the ground truth and the predicted bounding box
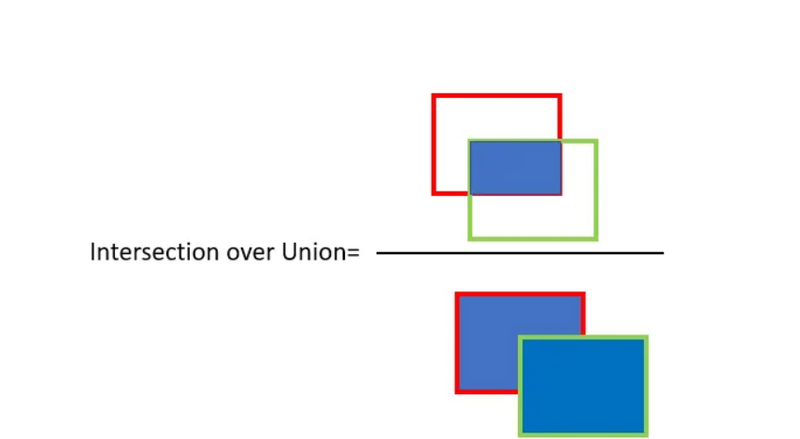
An IoU of 1 implies that predicted and the ground-truth bounding boxes perfectly overlap.
You can set a threshold value for the IoU to determine if the object detection is valid or not not.
Let’s say you set IoU to 0.5, in that case
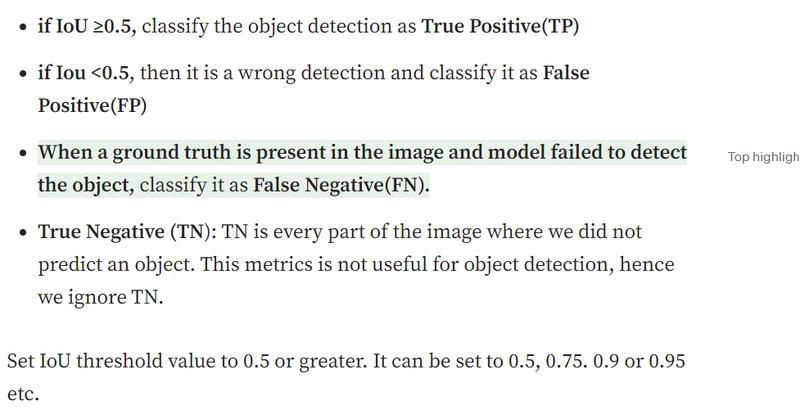
Set IoU threshold value to 0.5 or greater. It can be set to 0.5, 0.75. 0.9 or 0.95 etc.
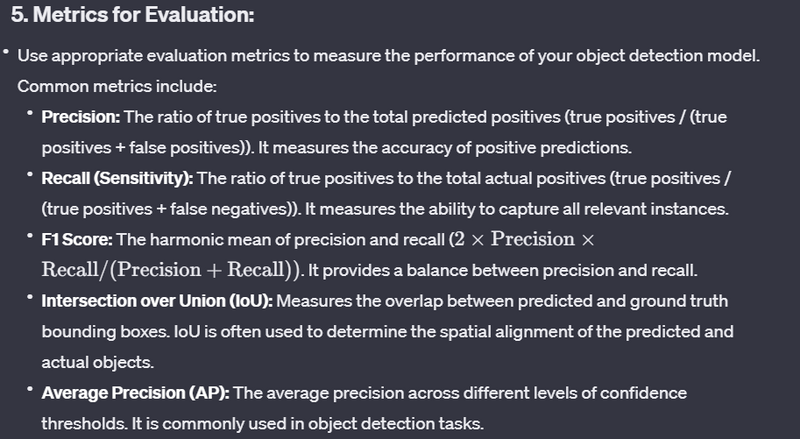
Use Precision and Recall as the metrics to evaluate the performance. Precision and Recall are calculated using true positives(TP), false positives(FP) and false negatives(FN)
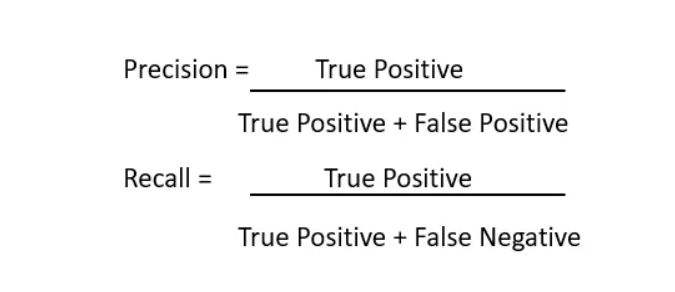
Calculate precision and recall for all objects present in the image.
You also need to consider the confidence score for each object detected by the model in the image. Consider all of the predicted bounding boxes with a confidence score above a certain threshold. Bounding boxes above the threshold value are considered as positive boxes and all predicted bounding boxes below the threshold value are considered as negative.
use 11-point interpolated average precision to calculate mean Average Precision(mAP)
How to calculate mAP using 11 point interpolation?
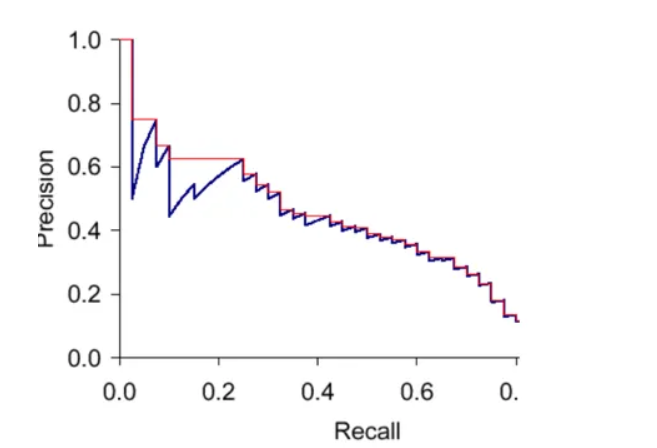
Step 1: Plot Precision and Recall
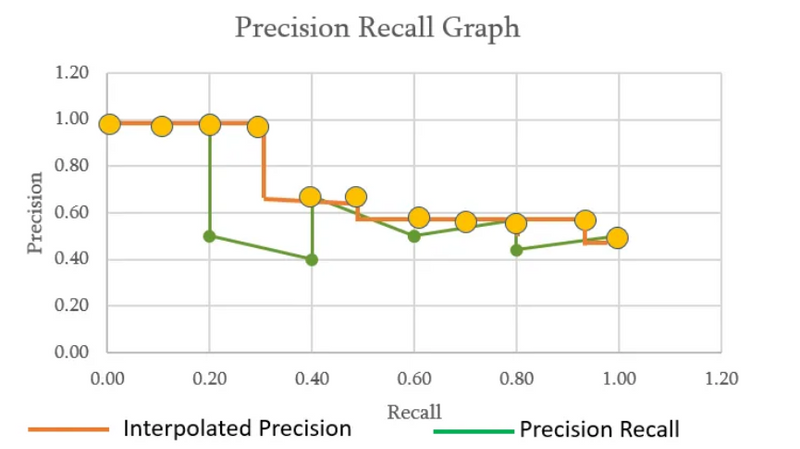
Plot the precision and recall values on a Precision Recall(PR) graph. PR graph is monotonically decreasing, there is always a trade-off between precision and recall. Increasing one will decrease the other. Sometimes PR graph is not always monotonically decreasing due to certain exceptions and/or lack of data.
Step 2: Calculate the mean Average Precision(mAP), use 11 point interpolation technique.
Interpolated precision is average precision measured at 11 equally spaced recall levels of 0.0, 0.1, 0.2, 0.3 ….0.9, 1.0 as shown in the figure above
The PR graph sometimes may not be monotonically decreasing, to resolve the issue, we set max of precision for a value of recall. Graphically, at each recall level, we replace each precision value with the maximum precision value to the right of that recall level i.e.; we take the maximum of all future points
The rationale is the willingness to look at higher precision values if both precision and recall get better.
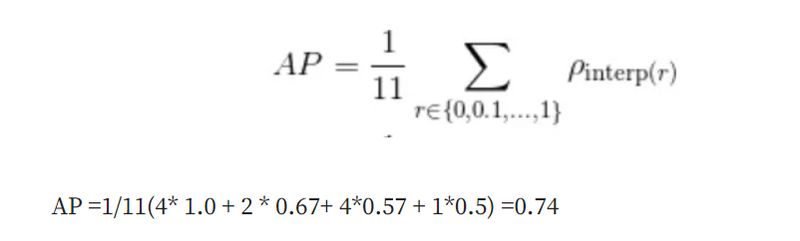
Finally calculate the arithmetic mean of the interpolated precision at each recall level for each information in the test collection.
mAP is always calculated over the entire dataset.
Let’s understand with an example as shown below, recall values are sorted for us to plot the PR graph
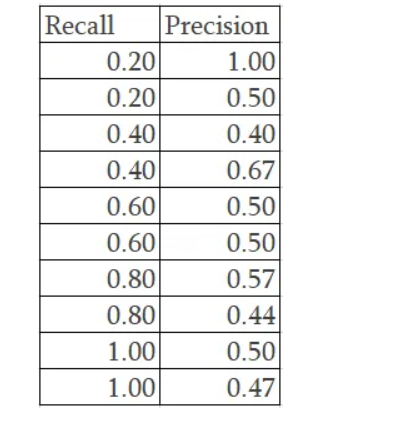
11 point interpolation will use the highest value for the precision for a recall value.
We create 11 equally spaced recall levels of 0.0, 0.1, 0.2, 0.3 ….0.9, 1.0
Recall of 0.2 has the highest precision value of 1.00. Recall value of 0.4 has different precision values 0.4, 0.67, 0.5. In this scenario, we use the highest precision value of 0.67. When the precision value is 0.6, we have precision value of 0.5 but for a recall of 0.8, we see a higher precision value of 0.57. Based on the rationale for 11 point interpolation, we take the maximum of all future points, so the precision that we need consider is 0.57 instead of 0.5. Finally for a recall of 1.0, we take the max precision which is 0.5.

Now plotting the Precision Recall as well as the Interpolated precision.
We finally apply the mean average precision formula
====================================================
Evaluating the performance of an object detection model is a crucial step in assessing its effectiveness and ensuring that it meets the requirements of a specific task or application. There are several metrics and evaluation methodologies commonly used for this purpose. Here's a step-by-step guide on how to evaluate the performance of an object detection model:
1. Data Splitting:
Split your dataset into training, validation, and test sets. The training set is used to train the model, the validation set helps in tuning hyperparameters and avoiding overfitting, and the test set is reserved for final evaluation.
2. Training the Model:
Train your object detection model using the training set. Ensure that the model converges and performs well on the validation set.
3. Model Prediction:
Use the trained model to make predictions on the test set or a held-out validation set that the model has not seen during training.
4. Post-Processing:
Apply any necessary post-processing steps, such as non-maximum suppression, to refine the model's predictions. These steps help eliminate duplicate or redundant bounding box predictions.
6. Confusion Matrix:
Create a confusion matrix to visualize true positives, false positives, false negatives, and true negatives. This matrix provides a detailed breakdown of the model's performance.
7. Precision-Recall Curve:
Plot a precision-recall curve to visualize the trade-off between precision and recall at different confidence thresholds.
8. Analysis and Fine-Tuning:
Analyze the results, identify areas for improvement, and consider fine-tuning the model based on the evaluation metrics and insights gained from the evaluation process.
9. Cross-Validation (Optional):
Consider using cross-validation if your dataset is limited. Cross-validation helps ensure that the model's performance is robust across different subsets of the data.
10. Additional Considerations:
Pay attention to the specific requirements of your application. Some applications may prioritize precision, while others may prioritize recall. Choose evaluation metrics accordingly.

Top comments (0)