Common Parmeter
lineplot
x,y,linewidth,label,marker,markersize
scatter
x,y,marker,s,alpha,label
xlabel,title,legend==fontsize,fontweight,labelpad
legend=loc
bar
x, y, width=0.5, bottom=None, color='blue', edgecolor='black', label='Bar Plot'

plt.savefig('sine_wave_plot.png', dpi=300, bbox_inches='tight', pad_inches=0.5, transparent=True)
IMSHOW
cmap(viridis,plasma,hot,cool),interpolation(nearest,bilinear,bicubic,none)
fig, axs = plt.subplots(2, 2, figsize=(10, 10))
axs[0, 0].imshow(img, interpolation='nearest')
axs[0, 0].set_title('Nearest')
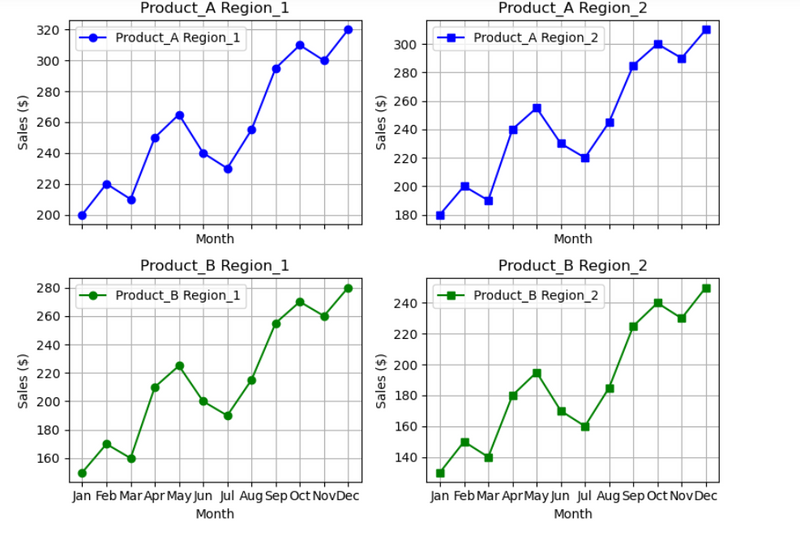
plt.colorbar()
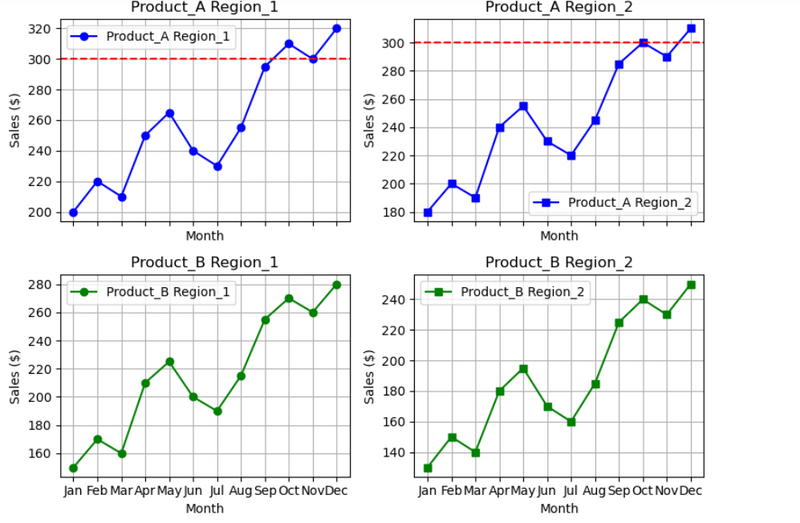
vmin,vmax,extent,aspect
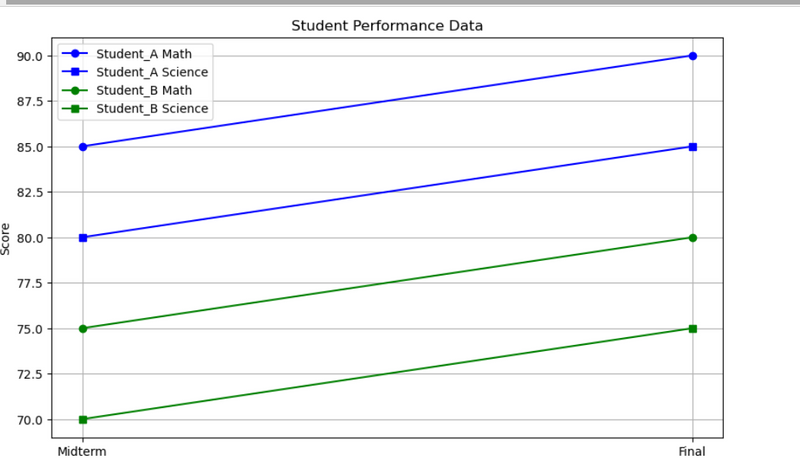
PIE
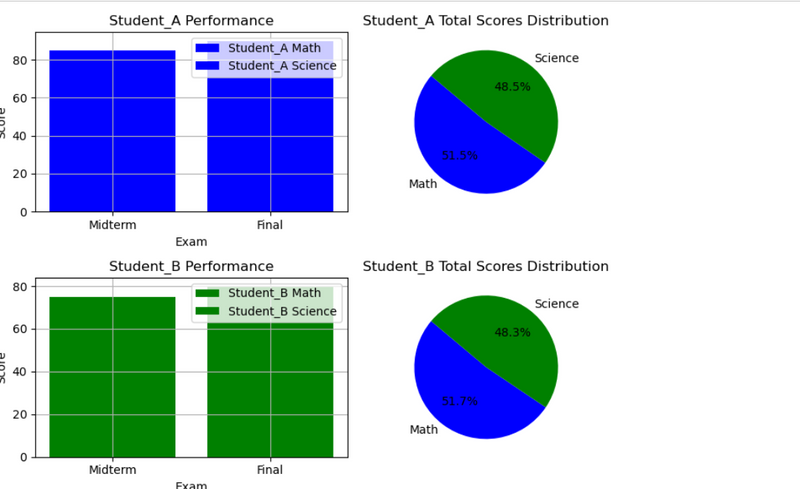
sizes,labels,autopct,startangle,axis,explode,colors,pctdistance,shadow,labeldistance,radius,
counterclock,wedgeprops,textprops,rotatelabels
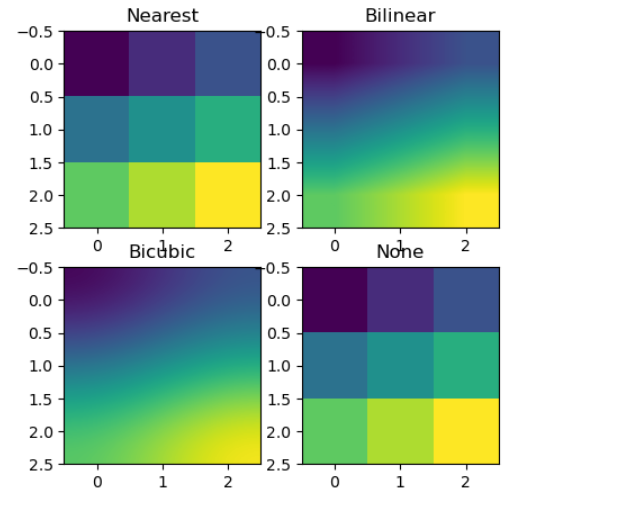
1.Draw plot a multiple line with different attribute using for loop and use list of tuple where x is common for all,y,marker and label
Key Points:how to apply for loop in list of multiple tuple each tuple contain attribute and different y value
# Create a small image with a few pixels
img = np.array([[0, 1, 2], [3, 4, 5], [6, 7, 8]])

# Define interpolation methods and their titles
interpolations = ['nearest', 'bilinear', 'bicubic', 'none']
titles = ['Nearest', 'Bilinear', 'Bicubic', 'None']

# Display the image with different interpolation methods
fig, axs = plt.subplots(2, 2, figsize=(5, 5))

# Use a loop to set the interpolation and title for each subplot
for ax, interp, title in zip(axs.flat, interpolations, titles):
    ax.imshow(img, interpolation=interp)
    ax.set_title(title)

plt.show()
output
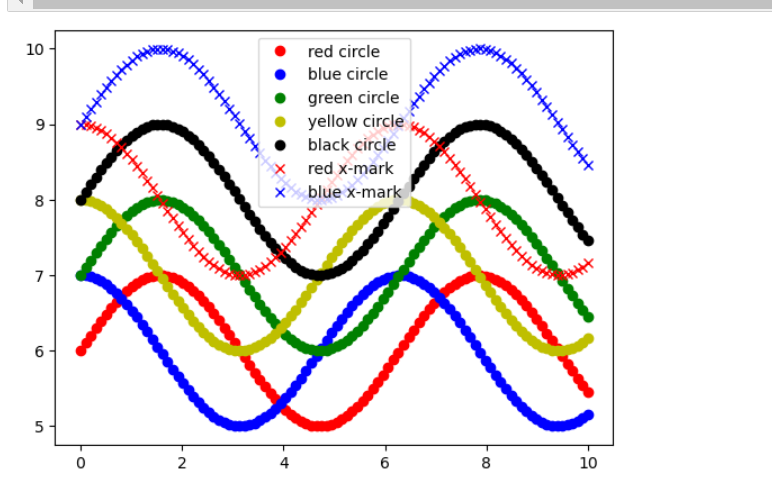
2.plot a multiple line using for loop and use list of tuple where x is common for all,y,marker and label is different
Key Points:LEARN=# how to apply for loop in list of multiple tuple each tuple contain attribute and different y value
LEARn#plot title is dynamic that is location
marker=='.',',','o','v','^','<','>'
label==point,pixel,circle,triangle_down,triangle_up,triangle_left,triangle_right,solid,dashed,dash-dot,dash-dot,red circle,green circle,blue circle,red x-mark,square,pentagon,hexagon,diamond
import matplotlib.pyplot as plt
import numpy as np

x = np.linspace(0, 10, 100)

# Data for y-values and their corresponding styles and labels
y_values = [
    (np.sin(x) + 6, 'ro', 'red circle'),
    (np.cos(x) + 6, 'bo', 'blue circle'),
    (np.sin(x) + 7, 'go', 'green circle'),
    (np.cos(x) + 7, 'yo', 'yellow circle'),
    (np.sin(x) + 8, 'ko', 'black circle'),
    (np.cos(x) + 8, 'rx', 'red x-mark'),
    (np.sin(x) + 9, 'bx', 'blue x-mark')
]

# Plot each y-value with its corresponding style and label
for y, style, label in y_values:
    plt.plot(x, y, style, label=label)

plt.legend()
plt.show()
output
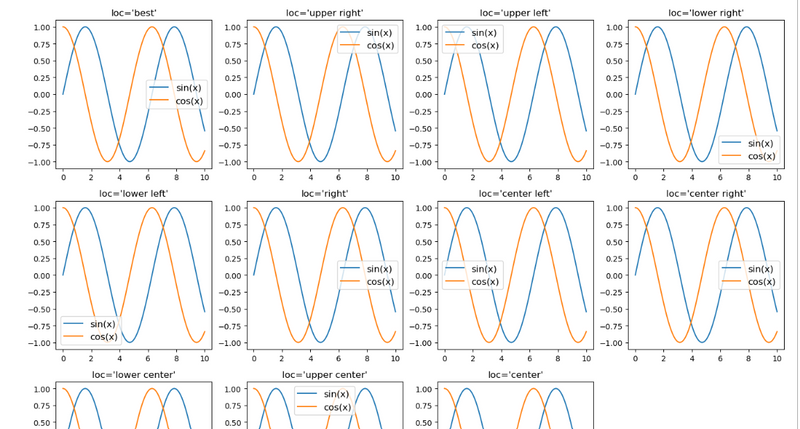
3.Create subplots with different legend locations
LEARN=#how each different location index used as parameter of subplot position
#Create subplots with different legend locations
#how each different location index used as parameter of subplot position
#plot title is dynamic that is location
# how to increse plot figure size length and width
import matplotlib.pyplot as plt
import numpy as np

x = np.linspace(0, 10, 100)
locs = ['best', 'upper right', 'upper left', 'lower right', 'lower left', 'right', 'center left', 'center right', 'lower center', 'upper center', 'center']

# Create a larger figure
plt.figure(figsize=(14, 10))

# Create subplots with different legend locations
for i, loc in enumerate(locs):
    plt.subplot(3, 4,i+1)
    plt.plot(x, np.sin(x), label='sin(x)')
    plt.plot(x, np.cos(x), label='cos(x)')
    plt.legend(loc=loc, fontsize=12)
    plt.title(f"loc='{loc}'")

# Adjust layout
plt.tight_layout()
plt.show()
output
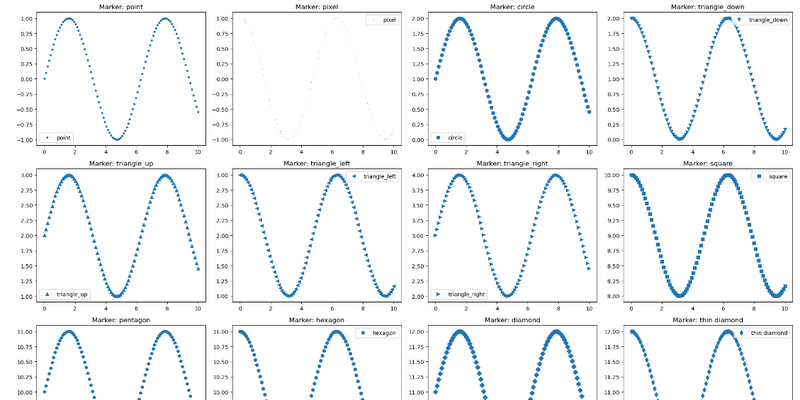
4.create a subplot where list of tuple contain different y,marker and label for subplots
LEARN=# how to increse plot figure size length and width
LEARn=#plot a multiple line with different attribute in different subplots using for loop and use list of tuple where x is common for all,y,marker and label
LEARN=#plot a dynamic title that is dynamic label
import matplotlib.pyplot as plt
import numpy as np

x = np.linspace(0, 10, 100)

# Define the data and markers
data_and_markers = [
    (np.sin(x), '.', 'point'),
    (np.cos(x), ',', 'pixel'),
    (np.sin(x) + 1, 'o', 'circle'),
    (np.cos(x) + 1, 'v', 'triangle_down'),
    (np.sin(x) + 2, '^', 'triangle_up'),
    (np.cos(x) + 2, '<', 'triangle_left'),
    (np.sin(x) + 3, '>', 'triangle_right'),
    (np.cos(x) + 9, 's', 'square'),
    (np.sin(x) + 10, 'p', 'pentagon'),
    (np.cos(x) + 10, 'h', 'hexagon'),
    (np.sin(x) + 11, 'D', 'diamond'),
    (np.cos(x) + 11, 'd', 'thin diamond'),
    (np.sin(x) + 6, 'ro', 'red circle'),
    (np.cos(x) + 6, 'bo', 'blue circle'),
    (np.sin(x) + 7, 'go', 'green circle'),
    (np.cos(x) + 7, 'yo', 'yellow circle'),
    (np.sin(x) + 8, 'ko', 'black circle'),
    (np.cos(x) + 8, 'rx', 'red x-mark'),
    (np.sin(x) + 9, 'bx', 'blue x-mark'),
]

# Create a larger figure
plt.figure(figsize=(20, 20))

# Plot each data series with a different marker
for i, (y, marker, label) in enumerate(data_and_markers):
    plt.subplot(5, 4, i + 1)
    plt.plot(x, y, marker, label=label)
    plt.legend()
    plt.title(f"Marker: {label}")

# Adjust layout
plt.tight_layout()
plt.show()
output
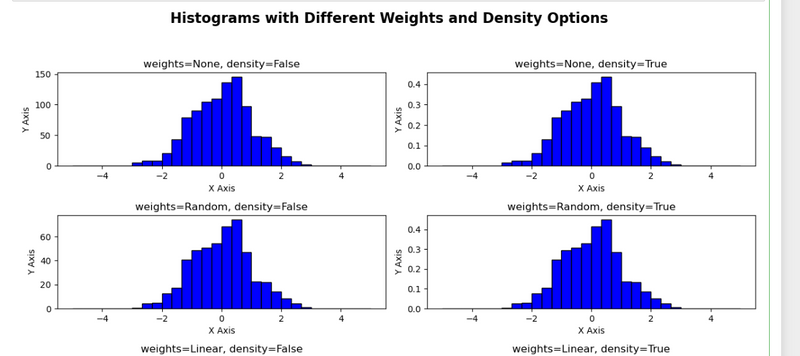
5.concise summary of combination of the weights and density options used for each histogram for combination use nested loop
import matplotlib.pyplot as plt
import numpy as np

# Generate random data
data = np.random.randn(1000)

# Define different weights and density options
weights_options = [None, np.random.rand(1000), np.linspace(0.1, 2, 1000)]
density_options = [False, True]

# Create subplots
fig, axes = plt.subplots(len(weights_options), len(density_options), figsize=(12, 8))
fig.suptitle('Histograms with Different Weights and Density Options', fontsize=16, fontweight='bold')

# Iterate over weights and density options
for i, weights in enumerate(weights_options):
    for j, density in enumerate(density_options):
        ax = axes[i, j]
        ax.hist(data, bins=30, range=(-5, 5), density=density, weights=weights, color='blue', edgecolor='black')
        weights_label = 'None' if weights is None else 'Random' if i == 1 else 'Linear'
        ax.set_title(f'weights={weights_label}, density={density}', fontsize=12)
        ax.set_xlabel('X Axis', fontsize=10)
        ax.set_ylabel('Y Axis', fontsize=10)

plt.tight_layout(rect=[0, 0.03, 1, 0.95])
plt.show

#weights_options contains three different weights options:
#None: No weights, all data points are treated equally.
#np.random.rand(1000): Random weights between 0 and 1 for each data point.
#np.linspace(0.1, 2, 1000): Linearly increasing weights from 0.1 to 2.
output
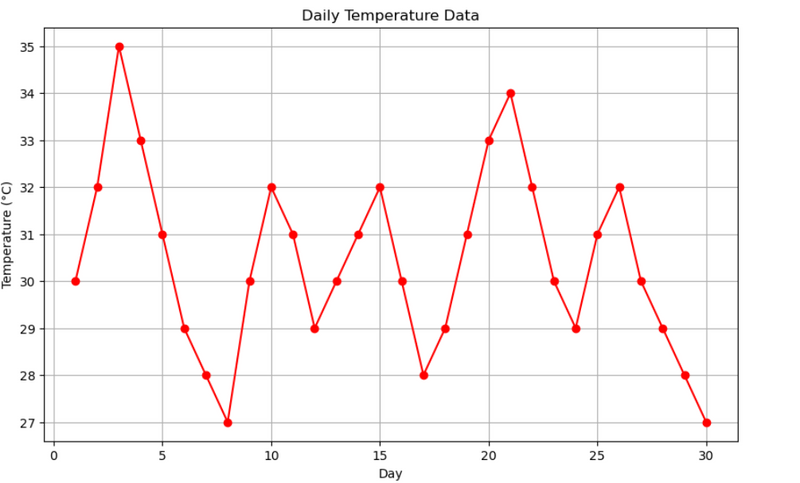
6.how to draw a line plot from table or dataframe
(LEARN:how table colunm use as parmeter of line plot as x and y)
LEARN# how to apply list of range as day as colunm name
# how to apply list of range as day as colunm name
#1. Daily Temperatures
#LEARN:how table  colunm use as parmeter of line plot as x and y
# how to apply list of range as day as colunm name
import pandas as pd
import matplotlib.pyplot as plt

# Sample data: Daily temperatures for one month
data = {
    'Day': list(range(1, 31)),
    'Temperature': [30, 32, 35, 33, 31, 29, 28, 27, 30, 32, 31, 29, 30, 31, 32, 30, 28, 29, 31, 33, 34, 32, 30, 29, 31, 32, 30, 29, 28, 27]
}
df = pd.DataFrame(data)

# Creating the line chart
plt.figure(figsize=(10, 6))
plt.plot(df['Day'], df['Temperature'], marker='o', linestyle='-', color='r')
plt.title('Daily Temperature Data')
plt.xlabel('Day')
plt.ylabel('Temperature (°C)')
plt.grid(True)

plt.show()
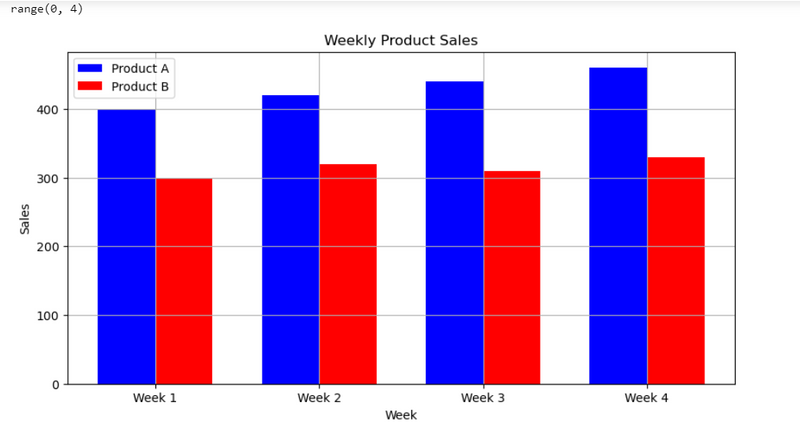
7.compare two product using bar plot on weekly sale
#. Weekly Product Sales
#compare two product using bar plot on weekly sale
#. Weekly Product Sales
#compare two product using bar plot on weekly sale
import pandas as pd
import matplotlib.pyplot as plt

# Sample data: Weekly product sales for one month
data = {
    'Week': ['Week 1', 'Week 2', 'Week 3', 'Week 4'],
    'Product_A': [400, 420, 440, 460],
    'Product_B': [300, 320, 310, 330]
}
df = pd.DataFrame(data)

# Creating the grouped bar chart
plt.figure(figsize=(10, 6))
bar_width = 0.35
index = range(len(df['Week']))
print(index)
plt.bar(index, df['Product_A'], bar_width, label='Product A', color='b')
plt.bar([i + bar_width for i in index], df['Product_B'], bar_width, label='Product B', color='r')

plt.xlabel('Week')
plt.ylabel('Sales')
plt.title('Weekly Product Sales')
plt.xticks([i + bar_width / 2 for i in index], df['Week'])
plt.legend()
plt.grid(True)

plt.show()
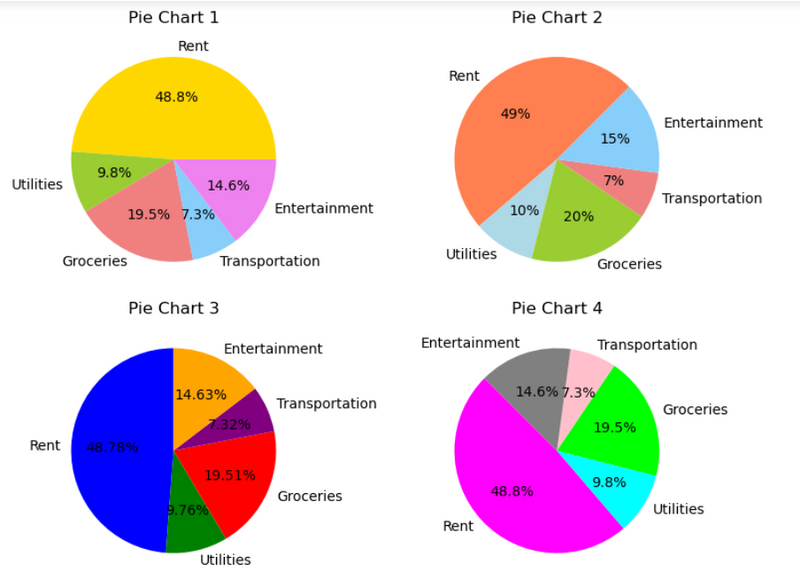
8.draw a piechart in different subplot to show Annual expenditure in different categories where attribute in list of dictionary use enumerate
#LEARN:in pie chat colors use as list like x(sizes) and y(labels).
Flatten the axes array for easy iteration to apply for loop(axs = axs.flatten())convert the 2D array of axes (subplots) into a 1D array
#LEARN: apply for loop and enumerate to show attribute in different subplot
draw a horizontal bar==plt.barh(df['Subject'], df['Grade'], color='c'
#draw a piechart in different subplot to show Annual expenditure in different categories where attribute in list of dictionary use enumerate
#LEARN:Flatten the axes array for easy iteration to apply for loop(axs = axs.flatten())convert the 2D array of axes (subplots) into a 1D arra
#LEARN: apply for loop and enumerate  to show attribute in different subplot
import pandas as pd
import matplotlib.pyplot as plt

# Sample data: Annual expenditure in different categories
data = {
    'Category': ['Rent', 'Utilities', 'Groceries', 'Transportation', 'Entertainment'],
    'Expenditure': [12000, 2400, 4800, 1800, 3600]
}
df = pd.DataFrame(data)

# Pie chart parameters for demonstration
attributes = [
    {'startangle': 0, 'autopct': '%1.1f%%', 'colors': ['gold', 'yellowgreen', 'lightcoral', 'lightskyblue', 'violet']},
    {'startangle': 45, 'autopct': '%1.0f%%', 'colors': ['coral', 'lightblue', 'yellowgreen', 'lightcoral', 'lightskyblue']},
    {'startangle': 90, 'autopct': '%1.2f%%', 'colors': ['blue', 'green', 'red', 'purple', 'orange']},
    {'startangle': 135, 'autopct': '%1.1f%%', 'colors': ['magenta', 'cyan', 'lime', 'pink', 'grey']}
]

# Create subplots
fig, axs = plt.subplots(2, 2, figsize=(8, 6))

# Flatten the axes array for easy iteration
axs = axs.flatten()

# Loop through each subplot and attributes
for i, attr in enumerate(attributes):
    axs[i].pie(df['Expenditure'], labels=df['Category'], autopct=attr['autopct'], startangle=attr['startangle'], colors=attr['colors'])
    axs[i].set_title(f'Pie Chart {i+1}')

plt.tight_layout()

plt.show()
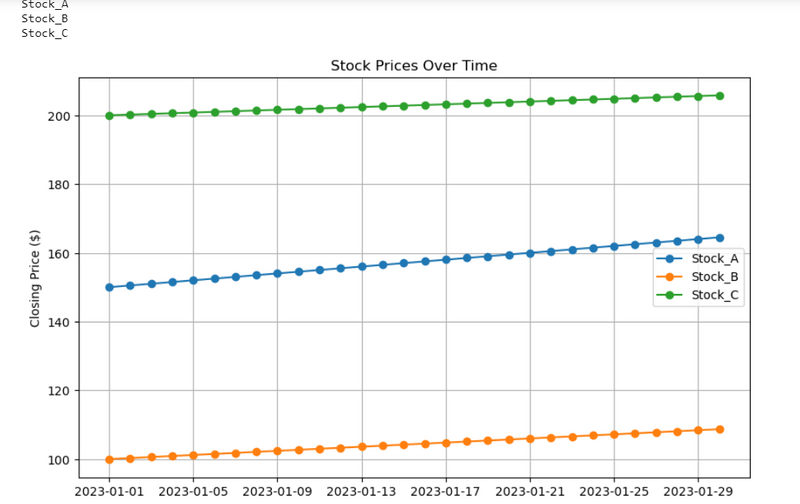
9.Visualizing Daily Stock Prices Over a Month for multiple stock
#1. Stock Prices Over Time
# apply single for loop in multiple colunm of dataframe or table
# apply single for loop in list of multiple data/stock
#Visualizing Daily Stock Prices Over a Month for multiple stock
#1. Stock Prices Over Time
# apply single for loop in multiple colunm of dataframe or table
# apply single for loop in list of multiple data/stock
#Visualizing Daily Stock Prices Over a Month for multiple stock


import pandas as pd
import matplotlib.pyplot as plt

# Sample data: Daily closing prices of multiple stocks over a month
data = {
    'Date': pd.date_range(start='2023-01-01', periods=30, freq='D'),
    'Stock_A': [150 + i*0.5 for i in range(30)],
    'Stock_B': [100 + i*0.3 for i in range(30)],
    'Stock_C': [200 + i*0.2 for i in range(30)]
}
df = pd.DataFrame(data)

# Plotting
plt.figure(figsize=(10, 6))
for stock in ['Stock_A', 'Stock_B', 'Stock_C']:
    print(stock)
    plt.plot(df['Date'], df[stock],marker='o', label=stock)

plt.title('Stock Prices Over Time')
plt.xlabel('Date')
plt.ylabel('Closing Price ($)')
plt.legend()
plt.grid(True)

plt.show()
output
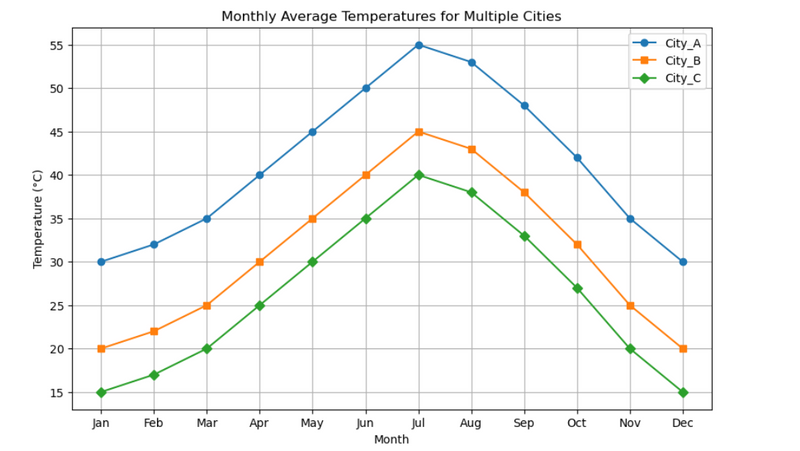
10.Monthly average temperatures for multiple cities using diffent marker for each city
LEARN:#apply single for loop in multiple colunm (cities) of dataframe or table
markers = ['o', 's', 'D']  # Circle, Square, Diamond
SIMLARLY
colors = ['b', 'g', 'r']
linestyles = ['-', '--', '-.']
markers = ['o', 's', '^']
#apply grid in each subplot
apply different attribute(marker) for different cities using zip method
#Monthly average temperatures for multiple cities using diffent marker for each city
#apply different attribute(marker) for different cities using zip method
import pandas as pd
import matplotlib.pyplot as plt

# Sample data: Monthly average temperatures for multiple cities
data = {
    'Month': ['Jan', 'Feb', 'Mar', 'Apr', 'May', 'Jun', 'Jul', 'Aug', 'Sep', 'Oct', 'Nov', 'Dec'],
    'City_A': [30, 32, 35, 40, 45, 50, 55, 53, 48, 42, 35, 30],
    'City_B': [20, 22, 25, 30, 35, 40, 45, 43, 38, 32, 25, 20],
    'City_C': [15, 17, 20, 25, 30, 35, 40, 38, 33, 27, 20, 15]
}
df = pd.DataFrame(data)

# Markers for different cities
markers = ['o', 's', 'D']  # Circle, Square, Diamond

# Plotting
plt.figure(figsize=(10, 6))
for city, marker in zip(['City_A', 'City_B', 'City_C'], markers):
    plt.plot(df['Month'], df[city], marker=marker, label=city)

plt.title('Monthly Average Temperatures for Multiple Cities')
plt.xlabel('Month')
plt.ylabel('Temperature (°C)')
plt.legend()
plt.grid(True)

plt.show()
output
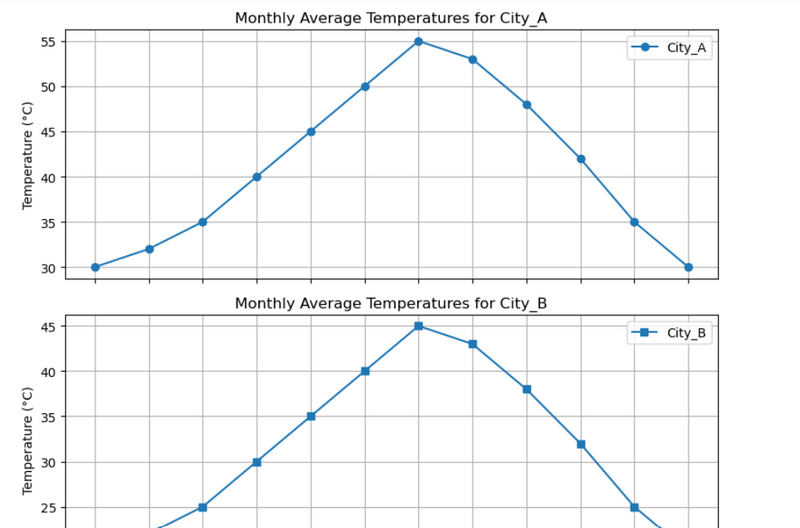
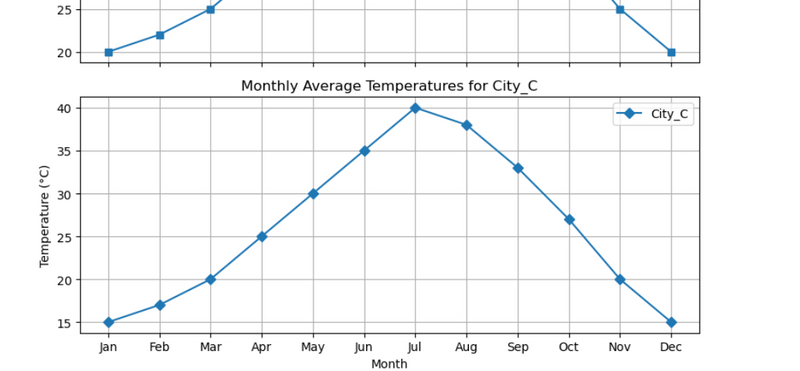
11.Monthly average temperatures for multiple cities using diffent marker for each city in different subplot
Key Points
#apply different attribute(marker) for different cities using zip method
Learn:#Plotting each city(colunm) data in a different subplot with different attribute(marker) using zip method
# sharex=True is used for common x axis for subplots
#Monthly average temperatures for multiple cities using diffent marker for each city in different subplot
#Plotting each city(colunm) data in a different subplot with different attribute(marker) using zip method
# sharex=True is used for common x axis for  subplots
import pandas as pd
import matplotlib.pyplot as plt

# Sample data: Monthly average temperatures for multiple cities
data = {
    'Month': ['Jan', 'Feb', 'Mar', 'Apr', 'May', 'Jun', 'Jul', 'Aug', 'Sep', 'Oct', 'Nov', 'Dec'],
    'City_A': [30, 32, 35, 40, 45, 50, 55, 53, 48, 42, 35, 30],
    'City_B': [20, 22, 25, 30, 35, 40, 45, 43, 38, 32, 25, 20],
    'City_C': [15, 17, 20, 25, 30, 35, 40, 38, 33, 27, 20, 15]
}
df = pd.DataFrame(data)

# Create subplots
fig, axs = plt.subplots(3, 1, figsize=(10, 15), sharex=True)

# Markers for different cities
markers = ['o', 's', 'D']  # Circle, Square, Diamond

# Plotting each city in a different subplot
for ax, city, marker in zip(axs, ['City_A', 'City_B', 'City_C'], markers):
    ax.plot(df['Month'], df[city], marker=marker, label=city)
    ax.set_title(f'Monthly Average Temperatures for {city}')
    ax.set_ylabel('Temperature (°C)')
    ax.legend()
    ax.grid(True)

# Setting the xlabel only once for the shared x-axis
axs[-1].set_xlabel('Month')

plt.tight_layout()
plt.show()
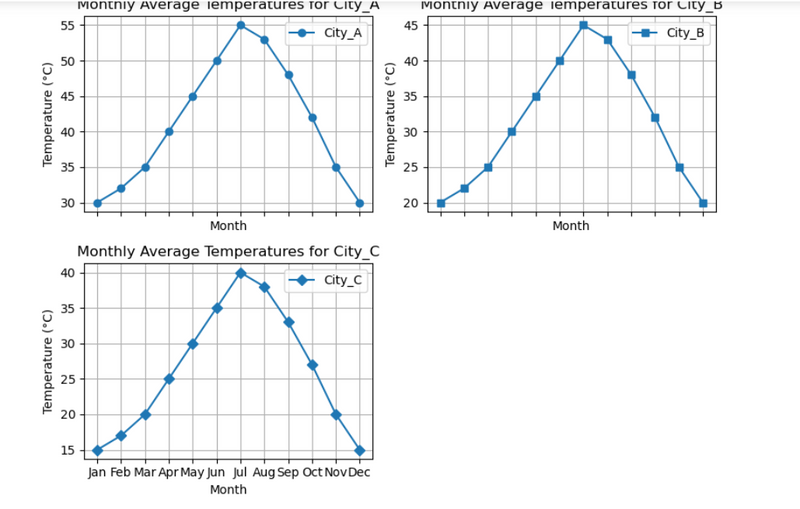
12.Monthly average temperatures for multiple cities using diffent marker for each city in different subplot in 2 row and 2 colunm
#Plotting each city(colunm) data in a different subplot with 2 rows and 2 columns with different attribute(marker) using zip method
#Leave the last subplot empty or use it for additional information
#Flatten the axs array for easier iteration
# Setting the xlabel only once for the shared x-axis
import pandas as pd
import matplotlib.pyplot as plt

# Sample data: Monthly average temperatures for multiple cities
data = {
    'Month': ['Jan', 'Feb', 'Mar', 'Apr', 'May', 'Jun', 'Jul', 'Aug', 'Sep', 'Oct', 'Nov', 'Dec'],
    'City_A': [30, 32, 35, 40, 45, 50, 55, 53, 48, 42, 35, 30],
    'City_B': [20, 22, 25, 30, 35, 40, 45, 43, 38, 32, 25, 20],
    'City_C': [15, 17, 20, 25, 30, 35, 40, 38, 33, 27, 20, 15]
}
df = pd.DataFrame(data)

# Create subplots with 2 rows and 2 columns
fig, axs = plt.subplots(2, 2, figsize=(12, 10), sharex=True)

# Markers for different cities
markers = ['o', 's', 'D']  # Circle, Square, Diamond

# Flatten the axs array for easier iteration
axs = axs.flatten()

# Plotting each city in a different subplot
for ax, city, marker in zip(axs[:3], ['City_A', 'City_B', 'City_C'], markers):
    ax.plot(df['Month'], df[city], marker=marker, label=city)
    ax.set_title(f'Monthly Average Temperatures for {city}')
    ax.set_ylabel('Temperature (°C)')
    ax.legend()
    ax.grid(True)

# Leave the last subplot empty or use it for additional information
axs[3].set_visible(False)

# Setting the xlabel only once for the shared x-axis
for ax in axs[:3]:
    ax.set_xlabel('Month')

plt.tight_layout()
plt.show()
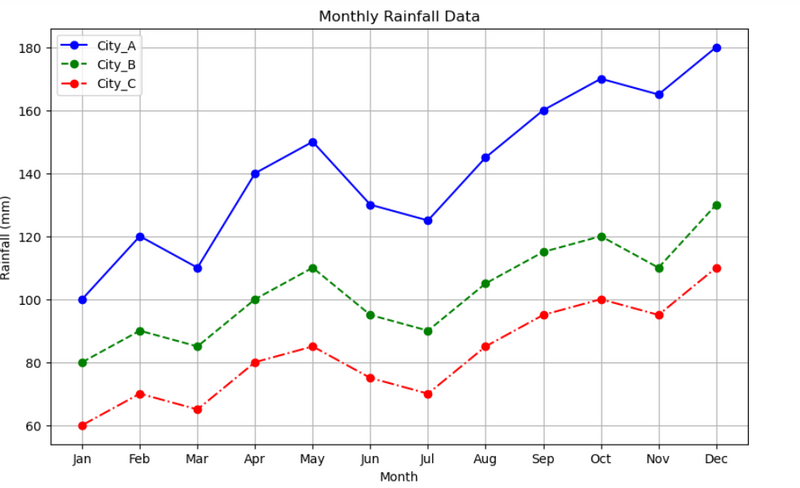
13.Project Description: Compare monthly rainfall data using different colors and linestyles
Keypoints
LEARN:#apply for loop in list of tuples contain different attribute using zip mthod
styles = [('b', '-'), ('g', '--'), ('r', '-.')]==color and linestyle
styles = [('b', 'o'), ('g', 's'), ('r', '^')]===color and marker
#Monthly Rainfall in Different Cities
#Project Description: Compare monthly rainfall data using different colors and linestyles.
#apply for loop in list of tuples contain different attribute using zip mthod
import pandas as pd
import matplotlib.pyplot as plt

# Sample data: Monthly rainfall data for different cities
data = {
    'Month': ['Jan', 'Feb', 'Mar', 'Apr', 'May', 'Jun', 'Jul', 'Aug', 'Sep', 'Oct', 'Nov', 'Dec'],
    'City_A': [100, 120, 110, 140, 150, 130, 125, 145, 160, 170, 165, 180],
    'City_B': [80, 90, 85, 100, 110, 95, 90, 105, 115, 120, 110, 130],
    'City_C': [60, 70, 65, 80, 85, 75, 70, 85, 95, 100, 95, 110]
}
df = pd.DataFrame(data)

# Define colors and linestyles for each city
styles = [('b', '-'), ('g', '--'), ('r', '-.')]

# Plotting
plt.figure(figsize=(10, 6))
for (city, (color, linestyle)) in zip(['City_A', 'City_B', 'City_C'], styles):
    plt.plot(df['Month'], df[city], marker='o', color=color, linestyle=linestyle, label=city)

plt.title('Monthly Rainfall Data')
plt.xlabel('Month')
plt.ylabel('Rainfall (mm)')
plt.legend()
plt.grid(True)

plt.show()
output
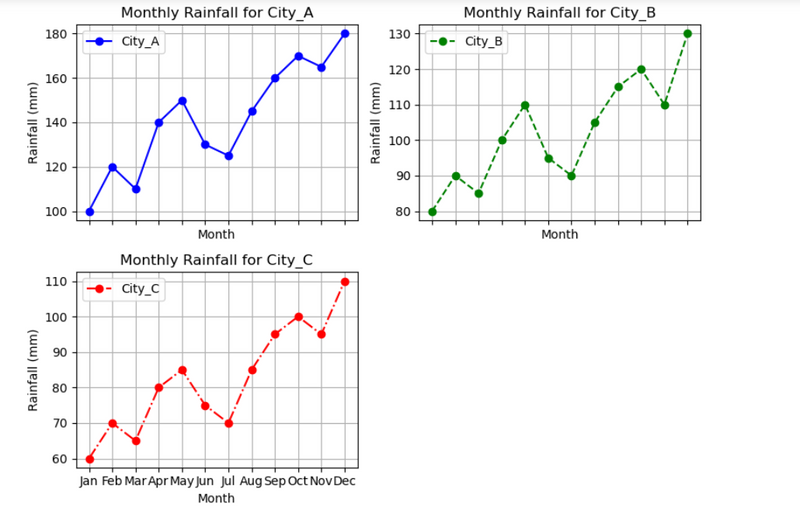
14.Compare monthly rainfall data using different colors and linestyles in different subplots
# Compare monthly rainfall data using different colors and linestyles in different subplots
import pandas as pd
import matplotlib.pyplot as plt

# Sample data: Monthly rainfall data for different cities
data = {
    'Month': ['Jan', 'Feb', 'Mar', 'Apr', 'May', 'Jun', 'Jul', 'Aug', 'Sep', 'Oct', 'Nov', 'Dec'],
    'City_A': [100, 120, 110, 140, 150, 130, 125, 145, 160, 170, 165, 180],
    'City_B': [80, 90, 85, 100, 110, 95, 90, 105, 115, 120, 110, 130],
    'City_C': [60, 70, 65, 80, 85, 75, 70, 85, 95, 100, 95, 110]
}
df = pd.DataFrame(data)

# Define colors and linestyles for each city
styles = [('b', '-'), ('g', '--'), ('r', '-.')]

# Create subplots with 2 rows and 2 columns
fig, axs = plt.subplots(2, 2, figsize=(8, 6), sharex=True)

# Flatten the axs array for easier iteration
axs = axs.flatten()

# Plotting each city in a different subplot
for ax, (city, (color, linestyle)) in zip(axs[:3], zip(['City_A', 'City_B', 'City_C'], styles)):
    ax.plot(df['Month'], df[city], marker='o', color=color, linestyle=linestyle, label=city)
    ax.set_title(f'Monthly Rainfall for {city}')
    ax.set_ylabel('Rainfall (mm)')
    ax.legend()
    ax.grid(True)

# Leave the last subplot empty or use it for additional information
axs[3].set_visible(False)

# Setting the xlabel only once for the shared x-axis
for ax in axs:
    ax.set_xlabel('Month')

plt.tight_layout()
plt.show()
output
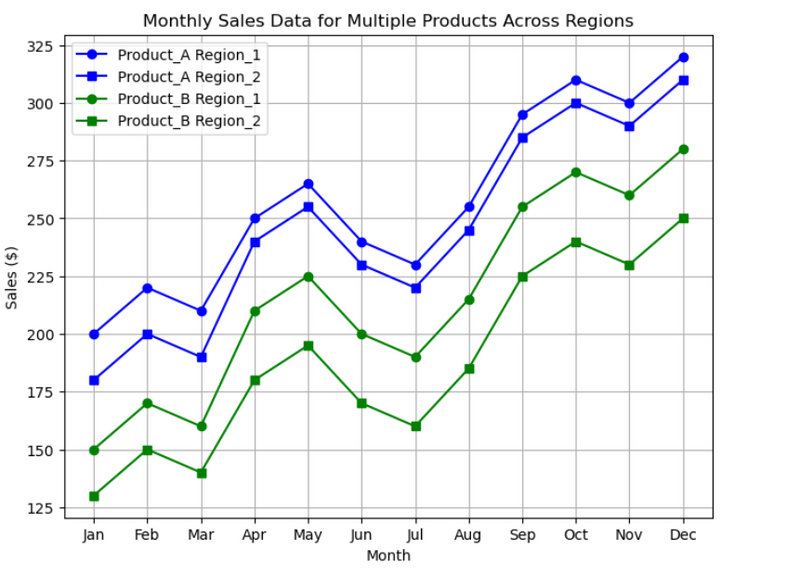
15.Visualize sales data for multiple products across different regions using different colors and markers
Key Points:
label=f'{product} {region}'
#LEARN: use nested lopp
Sales Data for Multiple Products Across Regions
Project Description: Visualize sales data for multiple products across different regions using different colors and markers.
#LEARN: use nested lopp
import pandas as pd
import matplotlib.pyplot as plt

# Sample data: Monthly sales data for multiple products across different regions
data = {
    'Month': ['Jan', 'Feb', 'Mar', 'Apr', 'May', 'Jun', 'Jul', 'Aug', 'Sep', 'Oct', 'Nov', 'Dec'],
    'Product_A_Region_1': [200, 220, 210, 250, 265, 240, 230, 255, 295, 310, 300, 320],
    'Product_A_Region_2': [180, 200, 190, 240, 255, 230, 220, 245, 285, 300, 290, 310],
    'Product_B_Region_1': [150, 170, 160, 210, 225, 200, 190, 215, 255, 270, 260, 280],
    'Product_B_Region_2': [130, 150, 140, 180, 195, 170, 160, 185, 225, 240, 230, 250]
}
df = pd.DataFrame(data)

# Define products, regions, colors, and markers
products = ['Product_A', 'Product_B']
regions = ['Region_1', 'Region_2']
colors = ['b', 'g']
markers = ['o', 's']

# Plotting
plt.figure(figsize=(12, 8))
for product, color in zip(products, colors):
    for region, marker in zip(regions, markers):
        plt.plot(df['Month'], df[f'{product}_{region}'], marker=marker, linestyle='-', color=color, label=f'{product} {region}')

plt.title('Monthly Sales Data for Multiple Products Across Regions')
plt.xlabel('Month')
plt.ylabel('Sales ($)')
plt.legend()
plt.grid(True)

plt.show()
#Project Description: Visualize sales data for multiple products across different regions using different colors and markers in different subplots
import pandas as pd
import matplotlib.pyplot as plt

# Sample data: Monthly sales data for multiple products across different regions
data = {
    'Month': ['Jan', 'Feb', 'Mar', 'Apr', 'May', 'Jun', 'Jul', 'Aug', 'Sep', 'Oct', 'Nov', 'Dec'],
    'Product_A_Region_1': [200, 220, 210, 250, 265, 240, 230, 255, 295, 310, 300, 320],
    'Product_A_Region_2': [180, 200, 190, 240, 255, 230, 220, 245, 285, 300, 290, 310],
    'Product_B_Region_1': [150, 170, 160, 210, 225, 200, 190, 215, 255, 270, 260, 280],
    'Product_B_Region_2': [130, 150, 140, 180, 195, 170, 160, 185, 225, 240, 230, 250]
}
df = pd.DataFrame(data)

# Define products, regions, colors, and markers
products = ['Product_A', 'Product_B']
regions = ['Region_1', 'Region_2']
colors = ['b', 'g']
markers = ['o', 's']

# Create subplots with 2 rows and 2 columns
fig, axs = plt.subplots(2, 2, figsize=(14, 10), sharex=True)

# Flatten the axs array for easier iteration
axs = axs.flatten()

# Plotting each product-region combination in a different subplot
index = 0
for product, color in zip(products, colors):
    for region, marker in zip(regions, markers):
        ax = axs[index]
        ax.plot(df['Month'], df[f'{product}_{region}'], marker=marker, linestyle='-', color=color, label=f'{product} {region}')
        ax.set_title(f'{product} {region}')
        ax.set_ylabel('Sales ($)')
        ax.legend()
        ax.grid(True)
        index += 1

# Setting the xlabel only once for the shared x-axis
for ax in axs:
    ax.set_xlabel('Month')

plt.tight_layout()
plt.show()
16.Sample data: Monthly sales data for multiple products across different regions
if sales increasing above 300 then draw horizontal line
# Sample data: Monthly sales data for multiple products across different regions
#if sales increasing above 300 then draw horizontal line
import pandas as pd
import matplotlib.pyplot as plt

# Sample data: Monthly sales data for multiple products across different regions
data = {
    'Month': ['Jan', 'Feb', 'Mar', 'Apr', 'May', 'Jun', 'Jul', 'Aug', 'Sep', 'Oct', 'Nov', 'Dec'],
    'Product_A_Region_1': [200, 220, 210, 250, 265, 240, 230, 255, 295, 310, 300, 320],
    'Product_A_Region_2': [180, 200, 190, 240, 255, 230, 220, 245, 285, 300, 290, 310],
    'Product_B_Region_1': [150, 170, 160, 210, 225, 200, 190, 215, 255, 270, 260, 280],
    'Product_B_Region_2': [130, 150, 140, 180, 195, 170, 160, 185, 225, 240, 230, 250]
}
df = pd.DataFrame(data)

# Define products, regions, colors, and markers
products = ['Product_A', 'Product_B']
regions = ['Region_1', 'Region_2']
colors = ['b', 'g']
markers = ['o', 's']

# Create subplots with 2 rows and 2 columns
fig, axs = plt.subplots(2, 2, figsize=(14, 10), sharex=True)

# Flatten the axs array for easier iteration
axs = axs.flatten()

# Plotting each product-region combination in a different subplot
index = 0
for product, color in zip(products, colors):
    for region, marker in zip(regions, markers):
        ax = axs[index]
        sales_data = df[f'{product}_{region}']
        ax.plot(df['Month'], sales_data, marker=marker, linestyle='-', color=color, label=f'{product} {region}')
        ax.set_title(f'{product} {region}')
        ax.set_ylabel('Sales ($)')
        ax.legend()
        ax.grid(True)
        # Draw horizontal line if any sales value exceeds 300
        if sales_data.max() > 300:
            ax.axhline(y=300, color='r', linestyle='--')
        index += 1

# Setting the xlabel only once for the shared x-axis
for ax in axs:
    ax.set_xlabel('Month')

plt.tight_layout()
plt.show()
17.**#Student Performance Data
Project Description: Compare student scores in different subjects using different colors and markers.**
import pandas as pd
import matplotlib.pyplot as plt

# Sample data: Scores of students in different subjects
data = {
    'Exam': ['Midterm', 'Final'],
    'Student_A_Math': [85, 90],
    'Student_A_Science': [80, 85],
    'Student_B_Math': [75, 80],
    'Student_B_Science': [70, 75]
}
df = pd.DataFrame(data)

# Define students, subjects, colors, and markers
students = ['Student_A', 'Student_B']
subjects = ['Math', 'Science']
colors = ['b', 'g']
markers = ['o', 's']

# Plotting
plt.figure(figsize=(10, 6))
for student, color in zip(students, colors):
    for subject, marker in zip(subjects, markers):
        plt.plot(df['Exam'], df[f'{student}_{subject}'], marker=marker, linestyle='-', color=color, label=f'{student} {subject}')

plt.title('Student Performance Data')
plt.xlabel('Exam')
plt.ylabel('Score')
plt.legend()
plt.grid(True)

plt.show()
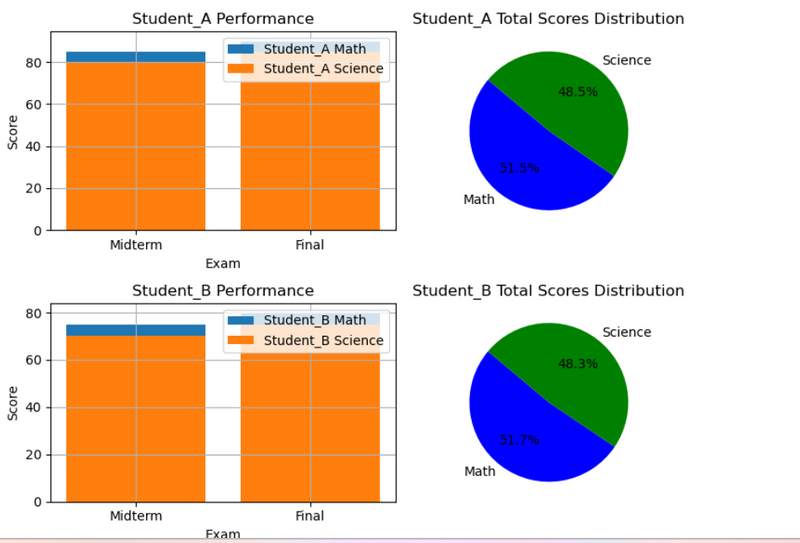
18.Compare student scores in different subjects using different colors and markers in different subplot 2 row and 2 col using bar and pie chart
import pandas as pd
import matplotlib.pyplot as plt

# Sample data: Scores of students in different subjects
data = {
    'Exam': ['Midterm', 'Final'],
    'Student_A_Math': [85, 90],
    'Student_A_Science': [80, 85],
    'Student_B_Math': [75, 80],
    'Student_B_Science': [70, 75]
}
df = pd.DataFrame(data)

# Define students, subjects, colors, and markers
students = ['Student_A', 'Student_B']
subjects = ['Math', 'Science']
colors = ['b', 'g']
markers = ['o', 's']

# Create subplots
fig, axs = plt.subplots(2, 2, figsize=(12, 10))

# Bar charts
for ax, student, color in zip(axs[:, 0], students, colors):
    for subject, marker in zip(subjects, markers):
        ax.bar(df['Exam'], df[f'{student}_{subject}'], label=f'{student} {subject}', color=color)
    ax.set_title(f'{student} Performance')
    ax.set_xlabel('Exam')
    ax.set_ylabel('Score')
    ax.legend()
    ax.grid(True)

# Pie charts
for ax, student, color in zip(axs[:, 1], students, colors):
    total_scores = [df[f'{student}_{subject}'].sum() for subject in subjects]
    ax.pie(total_scores, labels=subjects, colors=colors, autopct='%1.1f%%', startangle=140)
    ax.set_title(f'{student} Total Scores Distribution')

plt.tight_layout()
plt.show()
# Student Performance Data
# Project Description: Compare student scores in different subjects using different colors and markers.
import pandas as pd
import matplotlib.pyplot as plt

# Sample data: Scores of students in different subjects
data = {
    'Exam': ['Midterm', 'Final'],
    'Student_A_Math': [85, 90],
    'Student_A_Science': [80, 85],
    'Student_B_Math': [75, 80],
    'Student_B_Science': [70, 75]
}
df = pd.DataFrame(data)

# Define students, subjects, colors, and markers
students = ['Student_A', 'Student_B']
subjects = ['Math', 'Science']
colors = ['b', 'g']
markers = ['o', 's']

# Create subplots
fig, axs = plt.subplots(2, 2, figsize=(8, 6))

# Bar charts
for idx, student in enumerate(students):
    for subject in subjects:
        ax = axs[idx, 0]  # Select the subplot for bar chart
        ax.bar(df['Exam'], df[f'{student}_{subject}'], label=f'{student} {subject}')
        ax.set_title(f'{student} Performance')
        ax.set_xlabel('Exam')
        ax.set_ylabel('Score')
        ax.legend()
        ax.grid(True)

# Pie charts
for idx, student in enumerate(students):
    total_scores = [df[f'{student}_{subject}'].sum() for subject in subjects]
    ax = axs[idx, 1]  # Select the subplot for pie chart
    ax.pie(total_scores, labels=subjects, colors=colors, autopct='%1.1f%%', startangle=140)
    ax.set_title(f'{student} Total Scores Distribution')

plt.tight_layout()
plt.show()
sample data
# Sample data: Quarterly revenue for one year
data = {
    'Quarter': ['Q1', 'Q2', 'Q3', 'Q4'],
    'Revenue': [15000, 18000, 20000, 22000]
}
df = pd.DataFrame(data)
# Sample data: Student grades in different subjects
data = {
    'Subject': ['Math', 'Science', 'English', 'History', 'Art'],
    'Grade': [85, 90, 88, 92, 87]
}
df = pd.DataFrame(data)
# Sample data: Annual expenditure in different categories
data = {
    'Category': ['Rent', 'Utilities', 'Groceries', 'Transportation', 'Entertainment'],
    'Expenditure': [12000, 2400, 4800, 1800, 3600]
}
df = pd.DataFrame(data)
#Weather Data Comparison
#Project Description: Compare monthly temperature and precipitation data for multiple cities using different linestyles and colors
import pandas as pd
import matplotlib.pyplot as plt

# Sample data: Monthly temperature and precipitation data for multiple cities
data = {
    'Month': ['Jan', 'Feb', 'Mar', 'Apr', 'May', 'Jun', 'Jul', 'Aug', 'Sep', 'Oct', 'Nov', 'Dec'],
    'City_A_Temperature': [30, 32, 35, 40, 45, 50, 55, 53, 48, 42, 35, 30],
    'City_A_Precipitation': [5, 4, 6, 8, 9, 10, 12, 11, 7, 6, 5, 4],
    'City_B_Temperature': [20, 22, 25, 30, 35, 40, 45, 43, 38, 32, 25, 20],
    'City_B_Precipitation': [6, 5, 7, 9, 10, 11, 13, 12, 8, 7, 6, 5]
}
df = pd.DataFrame(data)
#Energy Consumption Data
#Project Description: Visualize monthly energy consumption data for multiple sectors in different regions using different colors and linestyles
import pandas as pd
import matplotlib.pyplot as plt

# Sample data: Monthly energy consumption data for multiple sectors in different regions
data = {
    'Month': ['Jan', 'Feb', 'Mar', 'Apr', 'May', 'Jun', 'Jul', 'Aug', 'Sep', 'Oct', 'Nov', 'Dec'],
    'Region_1_Residential': [100, 120, 110, 140, 150, 130, 125, 145, 160, 170, 165, 180],
    'Region_1_Commercial': [80, 90, 85, 100, 110, 95, 90, 105, 115, 120, 110, 130],
    'Region_2_Residential': [90, 110, 100, 130, 140, 120, 115, 135, 150, 160, 155, 170],
    'Region_2_Commercial': [70, 80, 75, 90, 100, 85, 80, 95, 105, 110, 100, 120]
}
df = pd.DataFrame(data)
#Multi-City Air Quality Data
#Project Description: Compare air quality index (AQI) data for multiple cities using different markers and linestyles.
import pandas as pd
import matplotlib.pyplot as plt

# Sample data: Monthly AQI data for multiple cities
data = {
    'Month': ['Jan', 'Feb', 'Mar', 'Apr', 'May', 'Jun', 'Jul', 'Aug', 'Sep', 'Oct', 'Nov', 'Dec'],
    'City_X_PM2_5': [35, 30, 40, 50, 55, 60, 65, 63, 58, 52, 45, 40],
    'City_X_PM10': [80, 70, 85, 100, 110, 115, 120, 118, 105, 95, 85, 80],
    'City_Y_PM2_5': [25, 20, 30, 40, 45, 50, 55, 53, 48, 42, 35, 30],
    'City_Y_PM10': [60, 50, 65, 80, 90, 95, 100, 98, 85, 75, 65, 60]
}
df = pd.DataFrame(data)
#Student Performance Data
#Project Description: Compare student scores in different subjects using different colors and markers.
import pandas as pd
import matplotlib.pyplot as plt

# Sample data: Scores of students in different subjects
data = {
    'Exam': ['Midterm', 'Final'],
    'Student_A_Math': [85, 90],
    'Student_A_Science': [80, 85],
    'Student_B_Math': [75, 80],
    'Student_B_Science': [70, 75]
}
df = pd.DataFrame(data)


Top comments (0)