What is APM?
APM stands for Application Performance Monitoring. It is a practice of monitoring and managing the performance and availability of software applications. APM tools are used to collect and analyze data about various aspects of an application's performance, including response time, throughput, resource utilization, and error rates.
The main goal of APM is to ensure that applications meet the performance expectations of end-users and to identify and resolve performance issues that may affect the user experience. By monitoring applications in real-time, APM allows developers and system administrators to quickly identify bottlenecks, diagnose problems, and optimize application performance.
APM typically provide features such as application profiling, transaction tracing, code-level diagnostics, and real-time monitoring of various performance metrics. They can also integrate with other monitoring tools to provide a comprehensive view of the entire technology stack, including servers, databases, and network infrastructure.
Benefits of APM ?
• Improved User Experience
• Faster Problem Identification and Resolution
• Optimized Resource Utilization
• Enhanced Scalability
• Data-Driven Decision Making
• Reduced Business Impact of Issues
• Better Collaboration Between Teams
• Monitoring of Distributed Architectures
• Compliance and Security
• Competitive Advantage
• End to End Visibility
Why We need to do APM?
Application Performance Monitoring (APM) is essential for several reasons that directly impact the success and efficiency of businesses and organizations. Here are some key reasons why APM is crucial:
• User Experience Improvement
• Reduced Downtime and Losses
• Data-Driven Decision Making
• Effective Troubleshooting and Root Cause Analysis
• Scalability and Capacity Planning
• Optimized Resource Utilization
• Support for Distributed Architectures
• Improved Collaboration and Accountability
• Security and Compliance
• Competitive Advantage
In summary, APM is vital for maintaining a competitive edge, improving operational efficiency, and delivering exceptional user experiences. It allows organizations to stay proactive in addressing performance issues, ultimately leading to enhanced business outcomes and customer satisfaction.
What are the Metrices you would get it from APM?
Application Performance Monitoring (APM) provides a wide range of metrics and data that give insights into the performance and behaviour of software applications. The specific metrics can vary depending on the APM tool used and the type of application being monitored. Here are some common metrics that you can obtain from APM:
• Response Time
• Throughput
• Error Rate
• Apdex Score
• CPU Utilization
• Memory Usage
• Network Latency
• Database Performance
• Transaction Traces
• Error Logs and Exceptions
• Resource Utilization
• Dependency Tracking
• Service Level Agreements (SLAs)
• User Session Analytics
• Geographical Distribution
• API and Web Service Performance
• Concurrency and Threading
• Custom Metrics
These metrics collectively provide a comprehensive view of the application's performance, allowing organizations to identify issues, optimize resources, and ensure a positive user experience.
What is a Transaction, Trace and Span?
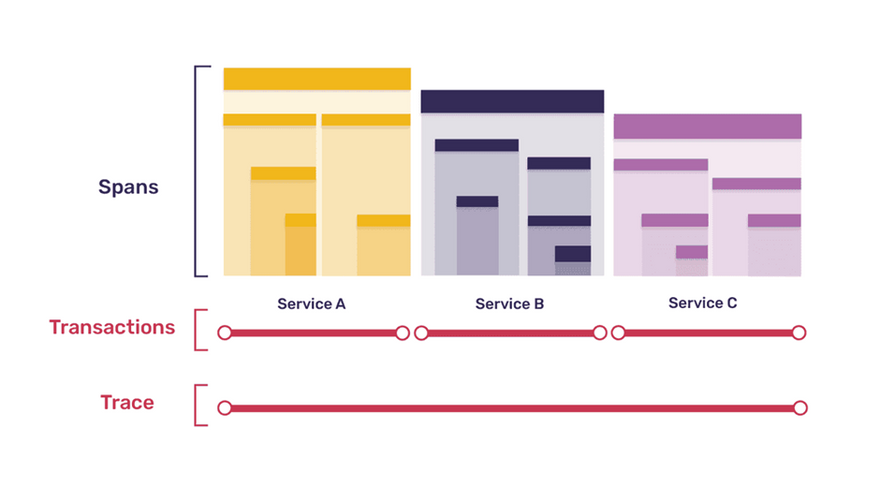
Transaction: In our example, a user visits the e-commerce website, searches for a specific product, adds it to the shopping cart, proceeds to checkout, and completes the purchase. Each of these steps represents a separate transaction within the application. So, the entire user journey from search to purchase constitutes a series of transactions.
Trace: A trace captures the detailed path and timing of a specific transaction as it traverses through various components and services. For instance, in our e-commerce application, a trace for the purchase transaction would include information about the time taken at each step, such as the search request, retrieval of product details, adding to the cart, processing payment, and generating the order confirmation. The trace provides a comprehensive view of the transaction's lifecycle, including any delays or performance issues encountered along the way.
Span: Within the trace of the purchase transaction, each individual operation or interaction with different components or services is represented by a span. For example, within the trace of the purchase transaction, there would be spans for the search request, product retrieval, cart update, payment processing, and order confirmation generation. Each span captures the duration and details of that specific operation, allowing for detailed analysis and identification of potential performance bottlenecks or errors.
By examining the transactions, traces, and spans within the e-commerce application, APM tools can provide insights into the performance of different steps, identify any slow or problematic components, and help pinpoint the root cause of any issues affecting the user experience. This enables organizations to optimize the application, improve response times, and ensure a smooth and satisfactory user journey.


Top comments (0)