Introduction
IT monitoring is the name for the products and processes used to determine if an organization’s information technology (IT) equipment and services are working properly and to detect and help resolve problems. The practice of IT monitoring has evolved significantly in recent years, in large part because IT environments have become significantly more complex. IT monitoring tools are now designed to monitor both on-premises and cloud-based infrastructures. The two major components for IT Monitoring used are Prometheus and Grafana.
Prometheus
Prometheus is an open-source systems monitoring and alerting toolkit originally built at SoundCloud. It is a standalone open source project and maintained independently of any company. Prometheus collects and stores its metrics as time series data, i.e. metrics information is stored with the timestamp at which it was recorded, alongside optional key-value pairs called labels.
Components:
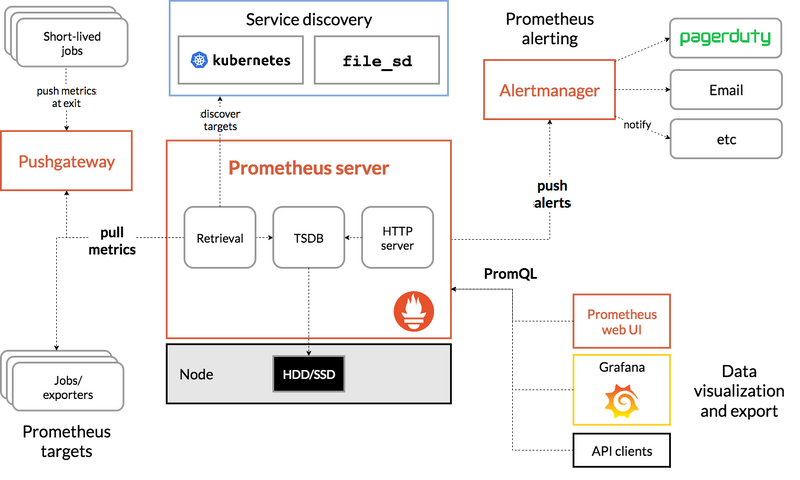
The monitoring ecosystem consists of multiple components, many of which are optional:
- the main Prometheus server which scrapes and stores time series data
- client libraries for instrumenting application code
- a push gateway for supporting short-lived jobs
- special-purpose exporters for services like HAProxy, StatsD, Graphite, etc.
- an alert manager to handle alerts
- various support tools Most Prometheus components are written in Go, making them easy to build and deploy as static binaries.
Grafana
Grafana open-source software enables you to query, visualize, alert on, and explore your metrics, logs, and traces wherever they are stored. Grafana OSS provides you with tools to turn your time-series database (TSDB) data into insightful graphs and visualizations. The Grafana OSS plugin framework also enables you to connect other data sources like NoSQL/SQL databases, ticketing tools like Jira or ServiceNow, and CI/CD tooling like GitLab.
Functions:
- Explore metrics, logs, and traces: Explore your data through ad-hoc queries and dynamic drilldown. Split view and compare different time ranges, queries and data sources side by side. Refer to Explore for more information.
- Alerts: If you’re using Grafana Alerting, then you can have alerts sent through a number of different alert notifiers, including PagerDuty, SMS, email, VictorOps, OpsGenie, or Mattermost.
- Annotations: Annotate graphs with rich events from different data sources. Hover over events to see the full event metadata and tags.
Ref: https://grafana.com/docs/grafana/latest/getting-started/get-started-grafana-prometheus/

Top comments (0)