Grafana is an open-source data visualization and monitoring tool designed to provide beautiful, insightful dashboards for analyzing and monitoring time-series data. It is often used in combination with other monitoring tools like Prometheus, Elasticsearch, and InfluxDB to visualize and track metrics, logs, and system health. Grafana has become a staple in DevOps, system monitoring, and observability due to its rich feature set, user-friendly interface, and strong community support.
What is Grafana?
Grafana is a powerful open-source platform that allows users to visualize, analyze, and understand data from various sources through interactive dashboards. It supports numerous data sources, including Prometheus, Graphite, MySQL, PostgreSQL, and Elasticsearch, among others. Grafana provides a rich set of visualization options like graphs, histograms, heatmaps, and tables, enabling users to create dynamic and visually appealing dashboards to monitor their infrastructure, applications, and performance metrics.
Key Features of Grafana:
- Customizable Dashboards: Grafana allows you to build custom dashboards with a wide variety of visualization options, including line charts, bar charts, and pie charts.
- Real-Time Monitoring: Grafana is designed to work with real-time data, helping teams monitor system health and performance in near-real-time.
- Multiple Data Sources: It supports integrations with a variety of data sources such as Prometheus, InfluxDB, MySQL, Elasticsearch, and more.
- Alerting: Grafana has a robust alerting system that can notify users of important changes in data, thresholds, or system statuses.
- User Management and Sharing: Grafana enables easy sharing of dashboards, either with public links or user access controls for team collaboration.
- Annotations: Users can annotate graphs to add contextual information about events, deployments, or changes, making it easier to correlate issues.
Top 10 Use Cases of Grafana:
Infrastructure Monitoring: Grafana is often used to monitor the health and performance of infrastructure components such as servers, containers, and virtual machines. By integrating with data sources like Prometheus and InfluxDB, it provides visibility into key metrics such as CPU usage, memory usage, disk I/O, and network traffic.
Application Performance Monitoring (APM): Grafana helps DevOps teams track application performance, including response times, error rates, and latency. This is essential for identifying bottlenecks and improving application reliability.
Business Intelligence and Data Analytics: Grafana can be used as a BI tool to visualize and analyze large sets of business data, providing insights into sales, operations, or customer behavior through interactive dashboards.
Security Monitoring: It is used to visualize security-related data, such as the number of failed login attempts, network traffic anomalies, or firewall logs. By correlating these metrics, Grafana helps in detecting and responding to security threats.
Network Monitoring: Grafana can track network performance metrics like bandwidth usage, packet loss, and latency, which helps ensure network reliability and troubleshoot network issues.
IoT and Device Monitoring: Grafana is a great tool for monitoring IoT devices and sensors. It can visualize sensor data like temperature, humidity, or pressure in real-time, providing insights into device health and operational status.
Cloud Infrastructure Monitoring: Grafana is used to monitor cloud infrastructure such as AWS, Azure, or GCP. By integrating with cloud services, it tracks cloud-specific metrics like instance health, load balancer traffic, and storage utilization.
Real-Time Data Visualization: With Grafana, you can visualize real-time data from a variety of sources, helping organizations monitor metrics continuously and make data-driven decisions.
DevOps Monitoring: Grafana is widely used in DevOps environments for continuous monitoring of deployments, build pipelines, and system performance, ensuring smooth operations and reducing downtime.
Business Operations Dashboards: It is used to create dashboards for visualizing operational KPIs such as sales, customer support metrics, and more, allowing business leaders to make data-driven decisions.
How Grafana Works and Architecture:
Architecture Overview:
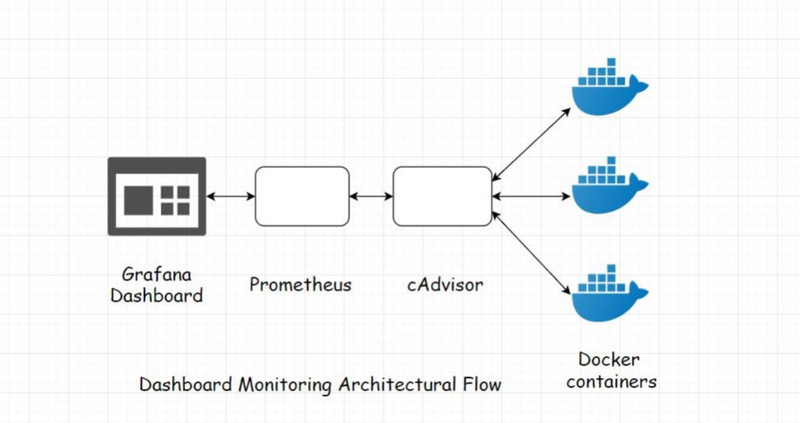
Grafana follows a client-server architecture. It serves as the client-side visualization tool, which pulls data from various data sources (servers), processes it, and renders it into insightful dashboards. The core components of Grafana’s architecture include:
- Grafana Server: The core component that handles requests for data and renders the dashboards. The server is responsible for retrieving data from multiple sources and serving it to the client.
- Data Sources: Grafana supports a wide range of data sources, including Prometheus, Elasticsearch, MySQL, PostgreSQL, and InfluxDB, to collect data for visualization.
- Dashboard: Grafana enables users to create highly customizable dashboards with various visualizations. These dashboards are interactive and can be filtered based on user requirements.
- Alerting: Alerts are configured based on user-defined thresholds, and notifications are sent via various channels like email, Slack, or webhooks.
How Grafana Works:
Grafana fetches time-series data from connected data sources, processes it through queries, and presents it in user-friendly formats such as charts and tables. This allows users to gain real-time insights into the health of their infrastructure, applications, and networks.
How to Install Grafana:
Step 1: Download Grafana
Grafana can be installed on Linux, Windows, and macOS. You can download the latest version from the official Grafana website:
- Download Link: Grafana Downloads
Step 2: Install Grafana
-
On Linux: Use package managers like
aptoryumfor installation, depending on the distribution. - On Windows: Download the installer and follow the installation wizard.
-
On macOS: Use Homebrew to install Grafana via
brew install grafana.
Step 3: Start Grafana Server
After installation, start the Grafana server by running the following command (depending on your OS):
sudo systemctl start grafana-server
Step 4: Access Grafana Web Interface
Once the server is running, access the Grafana web interface by navigating to http://localhost:3000 in your browser. The default login is admin for both the username and password.
Basic Tutorial: Getting Started with Grafana
- Install Grafana: Follow the installation steps above to get Grafana running on your system.
- Add Data Source: Log into the Grafana dashboard and click on the gear icon to go to the Data Sources page. Add your data source (e.g., Prometheus, MySQL, etc.) and configure it.
- Create a Dashboard: Click on the "+" icon and choose Dashboard. Add visualizations such as graphs, tables, and heatmaps to your dashboard.
- Query Data: Use Grafana’s query editor to fetch data from your configured data source. You can write SQL queries or use PromQL (for Prometheus) to retrieve metrics.
- Set Up Alerts: In your dashboard, configure alert rules that will trigger notifications based on certain conditions, such as when a metric exceeds a threshold.

Top comments (0)