I. Write it down a step to collect apache metrices to datadog
1. Install Datadog Agent in Ubuntu
Register at https://www.datadoghq.com/
Select the UBUNTU from the Datadog supported agent list
Run the commands in ubuntu -
$ D_AGENT_MAJOR_VERSION=7 DD_API_KEY=XXX DD_SITE="datadoghq.com" bash -c "$(curl -L https://s3.amazonaws.com/dd-agent/scripts/install_script.sh)"
systemctl start datadog-agent You would get output at the end of Installation
systemctl status datadog-agent
datadog-agent status
Adding you api key to Agent config: /etc/datadog-agent/datadog.yml
2. Install Apache HTTPD server in Ubuntu
$ sudo apt update # Setup webiste in default virtual host
$ sudo apt install apache2
$ rm /var/www/html/index.html

        $ vi /var/www/html/index.html
    <html>
    <head>
        <title> Welcome to DevOpsSchool.com </title>
    </head>
    <body>
        <p> I'm running this website on an Ubuntu Server server!
    </body>
    </html>
# Restart Apache
$ service apache2 reload # Validate
$ service apache2 restart
$ watch curl http://localhost
3. Go to datadog console, https://app.datadoghq.com/integrations -> Integrations -> Search For Apache and Install the integration
4. Enable mod_status & ExtendedStatus in Apache
By default, Apache ships with the mod_status module already enabled. Verify by running, $ ls /etc/apache2/mods-enabled | grep status*
Output:
status.conf
status.load
Enable mod_status module by invoking the command:
$ sudo /usr/sbin/a2enmod status Configure mod_status in Apache Ubuntu
` sudo vi /etc/apache2/mods-enabled/status.conf
Require all granted
`
Replace ip <>
$ sudo systemctl restart apache2 5. Enable Datadog Apache Integration configuration to start collecting your Apache metrics.
$ sudo systemctl status apache2
$ curl http://localhost/server-status
` $ cd /etc/datadog-agent/conf.d/apache.d/
$ sudo cp conf.yaml.example conf.yaml
$ sudo vi conf.yaml
`              instances:
                    - apache_status_url: http:localhost/server-status?auto        #localhost can be added with IP if it is a remote agent
$ sudo systemctl restart datadog-agent
watch curl http://localhost/ 6. Validate if datadog agent is monitoring Apache
$ datadog-agent configcheck | grep apache -A 5 -B 5 Output:
=== apache check ===
Configuration provider: file
Configuration source: file:/etc/datadog-agent/conf.d/apache.d/conf.yaml
$ datadog-agent status | grep apache -B 5 -A 15 ==Running Checks apache====
- Create a dummy traffic on Apache
$ while true; do curl -s -o /dev/null http://localhost & done
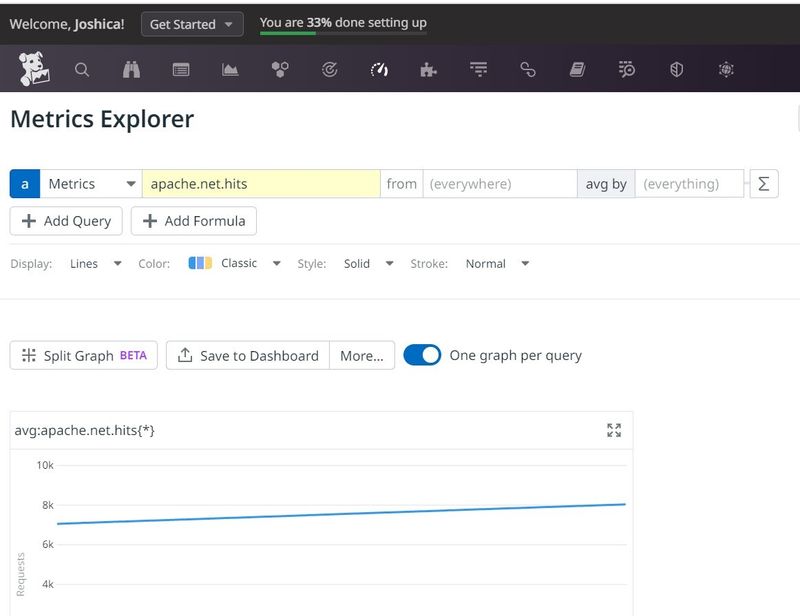
- Verify the Apache Metrix on Datadog Console
II. Write it down a step to collect tomcat metrices to datadog
Step A: Loginto Datadog console, Integrations -> Search for Tomcat and Click Install
Step 1: Install Open JDK 11
$ sudo apt-get updateStep 2: Download Apache Tomcat 9 in ubuntu:
$ sudo apt-get install openjdk-11-jdk -y
$ apt install openjdk-11-jdk-headless -y
$ sudo apt-get install wget unzip -yStep 3: Enable JMX Remote in Tomcat 8 to Monitor & Administer
$ sudo -s
$ cd /opt/
$ wget https://dlcdn.apache.org/tomcat/tomcat-9/v9.0.80/bin/apache-tomcat-9.0.80.zip
$ unzip apache-tomcat-9.0.80.zip
$ cd apache-tomcat-9.0.73
$ cd bin
$ chmod -R 755 .
$ ls
$ ./shutdown.sh

$ ./startup.sh
$ vi /opt/apache-tomcat-9.0.73/bin/catalina.sh
Add these below lines
CATALINA_OPTS="-Dcom.sun.management.jmxremote -Dcom.sun.management.jmxremote.port=9012 -Dcom.sun.management.jmxremote.ssl=false -Dcom.sun.management.jmxremote.authenticate=false"
$ ./shutdown.sh
$ ./startup.sh
Step 4: Configure and enable Tomcat intergration in Datadog agent
$ cd /etc/datadog-agent/conf.d/tomcat.d/ Output:
$ cp conf.yaml.example conf.yaml
$ datadog-agent configcheck
$ systemctl restart datadog-agent
$ systemctl status datadog-agent
$ datadog-agent configcheck | grep tomcat -A 1 B 1
==tomcat check====
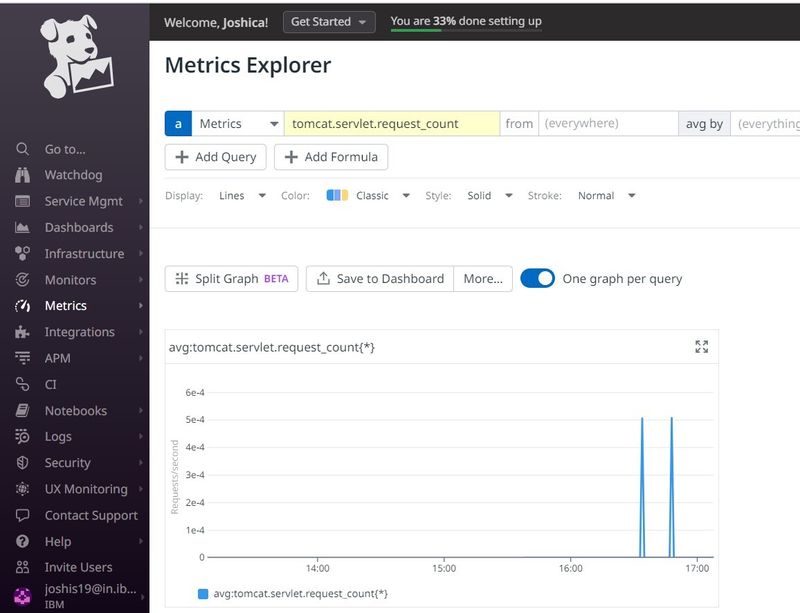
Step 5: In datadog console, Go to Metrics tab, search for tomcat metrices and also in Infrastructure list under Ubuntu VM check for tomcat apps
III. Write it down a step to collect docker metrices to datadog
Step 1 – Enable Datadog Process Monitoring
Step 2 – Install Docker Server
Step 3 – Enable Docker integration with Datadog
These commands to configure Agent for Docker Intergration.
Add the user running the Agent to Docker's group.
$ usermod -a -G docker dd-agent
`$ cd /etc/datadog-agent/conf.d/docker.d/
$ cp conf.yaml.default conf.yaml
$ vi conf.yaml
`
ad_identifiers:
- _docker
init_config:
instances:
- url: "unix://var/run/docker.sock"
new_tag_names: true
`
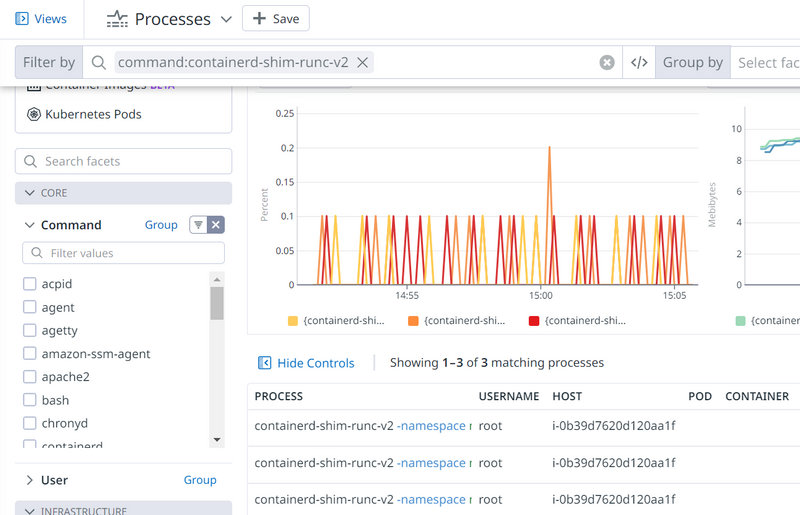
$ systemctl restart datadog-agent $ systemctl status datadog-agent$ datadog-agent configcheck $ datadog-agent check docker $ datadog-agent status | grep docker -B 5 -A 5========= Collector ========= Step 4 – Create few containers and Verify$ docker run -itd ubuntu $ docker run -itd ubuntu $ docker run -itd ubuntu $ docker ps `Step 5 - Verify Containers at Datadog console In console -> Integrations -> Docker Install -> Metrics -> Explorer -> Search for command:containerd-shim-runc-v2
- url: "unix://var/run/docker.sock"
new_tag_names: true
`
IV. - Write it down a step to collect mysql metrices to datadog Step 1 – Install Datadog Agent in Ubuntu
Register at https://www.datadoghq.com/
Select the UBUNTU from the Datadog supported agent list
Run the commands in ubuntu -
            $ D_AGENT_MAJOR_VERSION=7 DD_API_KEY=XXX DD_SITE="datadoghq.com" bash -c "$(curl -L https://s3.amazonaws.com/dd-agent/scripts/install_script.sh)"
                $ systemctl start datadog-agent
                $ systemctl status datadog-agent
        $ datadog-agent status
          You would get output at the end of Installation
              Adding you api key to Agent config: /etc/datadog-agent/datadog.yml
    (Mysql by default comes with Dataagent package)
Step 2 – Prepare MySQL. On each MySQL server, create a database user for the Datadog Agent:
Go to datadog console, Integrations, Mysql -> Install
Step 3 - Login Mysql in Ubuntu. Run the below commands
        $ sudo su -
        $ mysql -h localhost -u root -p
        mysql> CREATE USER 'datadog'@'localhost' IDENTIFIED BY '<UNIQUEPASSWORD>';
        mysql> CREATE USER 'datadog'@'localhost' IDENTIFIED WITH mysql_native_password by '<UNIQUEPASSWORD>';
        mysql -u datadog --password='<UNIQUEPASSWORD>' -e "show status" | \
grep Uptime && echo -e "3[0;32mMySQL user - OK3[0m" || \
echo -e "3[0;31mCannot connect to MySQL3[0m"
        mysql -u datadog --password='<UNIQUEPASSWORD>' -e "show slave status" && \
echo -e "3[0;32mMySQL grant - OK3[0m" || \
echo -e "3[0;31mMissing REPLICATION CLIENT grant3[0m"
Step 4 - The Agent needs a few privileges to collect metrics. Grant the user the following limited privileges ONLY:
        mysql> GRANT REPLICATION CLIENT ON *.* TO 'datadog'@'localhost' WITH MAX_USER_CONNECTIONS 5;
        mysql> GRANT PROCESS ON *.* TO 'datadog'@'localhost';
        mysql> ALTER USER 'datadog'@'localhost' WITH MAX_USER_CONNECTIONS 5;
If enabled, metrics can be collected from the performance_schema database by granting an additional privilege:
        mysql> show databases like 'performance_schema';
Output:
            | Database (performance_schema) |
                +-------------------------------+
                | performance_schema            |
        mysql> GRANT SELECT ON performance_schema.* TO 'datadog'@'localhost';
Step 5 - Configure Datadog agent to start collection mysql metrics.
Edit the mysql.d/conf.yaml file, in the conf.d/ folder at the root of your Agent’s configuration directory to start collecting your MySQL metrics and logs
        $ cd /etc/datadog-agent/conf.d/mysql.d/
        $ sudo cp conf.yaml.example conf.yaml
        $ sudo vi conf.yaml
        init_config:
        instances:
          - server: 127.0.0.1
            user: datadog
            pass: "<YOUR_CHOSEN_PASSWORD>" # from the CREATE USER step earlier
            port: "<YOUR_MYSQL_PORT>" # e.g. 3306
            options:
                  replication: false
                  galera_cluster: true
                  extra_status_metrics: true
                  extra_innodb_metrics: true
                  extra_performance_metrics: true
                  schema_size_metrics: false
                  disable_innodb_metrics: false
Note: Wrap your password in single quotes in case a special character is present.
Step 6: Validate mysql metrices
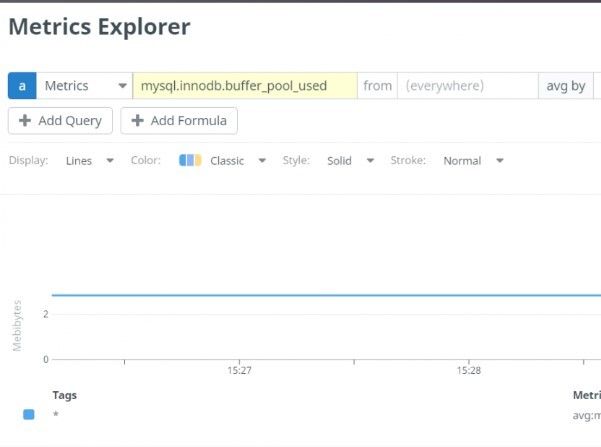
$ systemctl restart datadog-agentIn metrics explorer UI console, You would be able to see the mysql data reporting
$ datadog-agent status
+++++++++++++++++++++++++++++++++++END+++++++++++++++++++++++++

Top comments (0)