
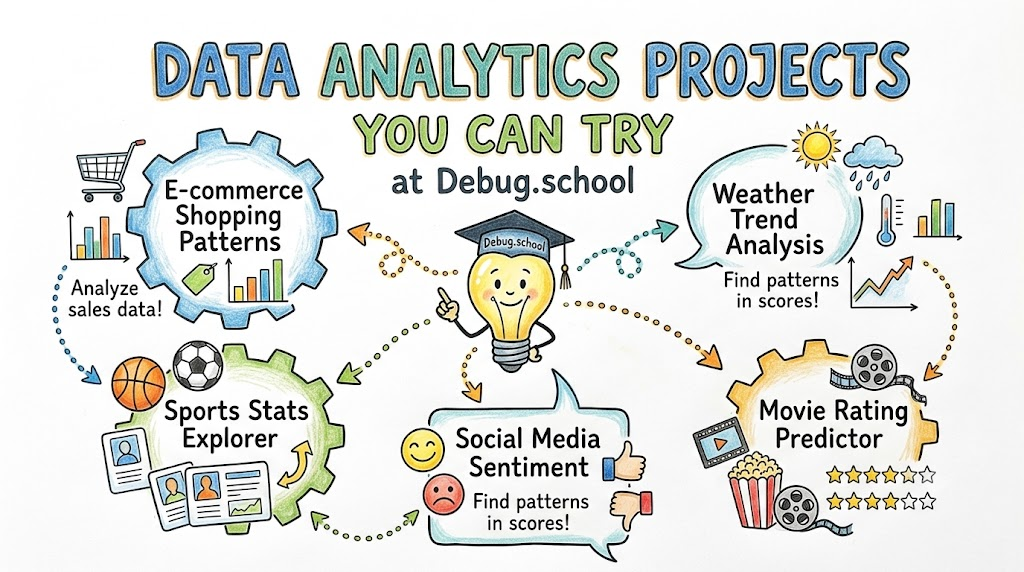
Data analytics sounds big and scary to many people. But you can learn it quickly with the right practice. You can build fun, real-world skills by joining debug.school. This learning platform helps you practice on real datasets. You will learn to clean messy numbers and build bright colorful charts.
Every project teaches you to think like a real data detective. You will discover secret trends inside facts and numbers. Best of all, you do not need hard math to start.
What Is Data Analytics for Beginners?
Looking at Facts to Answer Questions
Data analytics simply means looking at facts to answer questions. Think of it like sorting your toy box. You might count how many red cars or blue blocks you have.
Next, you spot patterns in those numbers. Businesses do the same thing every single day. They look at past sales to see what people buy most.
So, analytics turns messy numbers into clear clues. It helps bosses make smart choices for their teams.
Turning Clues into Pretty Pictures
Computers store numbers in huge, boring spreadsheets. Staring at raw rows makes your eyes tired. That is why analysts build colorful pictures called charts.
A bar chart shows which item sold best right away. A line graph shows if sales went up or down.
These pictures tell a story without using confusing words. Anyone can look at a good chart and understand the main point instantly.
Key Operational Concepts You Must Know
Cleaning Up Dirty Records
Real data is never neat or tidy when you first find it. People make typos, leave blank spots, or enter the same name twice.
You must clean these mistakes before you do any math. If you leave bad numbers inside, your answers will come out wrong.
So, analysts spend most of their time tidying up tables. They fix spelling, drop duplicate rows, and fill missing spaces.
Asking the Right Questions First
You cannot find a good answer if you do not know the question. Good analysts always start with a clear goal.
For example, do you want to find the top toy this year? Or do you want to see which store loses money?
Next, you pick only the data that helps answer that question. This keeps your project fast, simple, and neat.
Platform Implementation vs. Culture — What's the Real Difference?
Tools Help but People Matter Most
Many companies buy super fancy computer tools. They think expensive apps will solve all their problems.
But a shiny new tool cannot fix bad habits. If workers do not trust data, they will just guess instead.
So, true success comes from a healthy team mindset, not just costly software.
Building a Strong Team Mindset
A great data culture encourages everyone to share and learn together. Workers ask questions instead of making blind guesses.
Also, people test their ideas using facts from real reports. They celebrate when data shows them a better way to work.
When tools and team habits match, magic happens. Teams make faster choices and avoid costly mistakes.
| Area | Tool Setup | Team Culture |
|---|---|---|
| Main Goal | Install new apps and connect data. | Teach workers to trust real facts. |
| Daily Action | Run software on fast servers. | Ask good questions before acting. |
| Big Win | Fast charts and neat reports. | Smart choices across the whole team. |
Real-World Use Cases of Modern Operations
Tracking Online Shopping Habits
Online stores use data every minute of the day. They watch which items shoppers click on most.
Next, the website shows other toys that match your tastes. This makes shopping fast, fun, and easy for customers.
- Main Goal: Help shoppers find what they love quickly.
- Helpful Clues: Clicks, search words, and cart history.
- Big Result: Happy buyers and higher shop sales.
Predicting Hospital Bed Needs
Hospitals use facts to keep sick people safe and comfortable. Computers track how many patients arrive each week.
So, doctors know when flu season might fill up beds. They schedule extra nurses before the rush begins.
- Main Goal: Make sure every patient gets a bed.
- Helpful Clues: Past patient visits and weather logs.
- Big Result: Fast care and short waiting lines.
Common Mistakes in Operations Engineering
Using Too Many Hard Tools at Once
Beginners often try to use five hard coding tools on day one. They install giant apps that they do not really need.
Next, their computer slows down, and they feel lost. It is always better to start with one simple tool.
Master a basic spreadsheet before you write hard code. Simple tools often solve big problems faster.
Forgetting to Check the Final Output
Sometimes, a computer script runs without showing any errors. But that does not mean the answer is right.
For example, a total might show a negative number for sales. A computer will not always know that is impossible.
So, you must always look at the results yourself. Use your common sense to spot strange numbers.
How to Become an Operations Expert — Career Roadmap
- Step 1: Learn Basic Spreadsheets Start with rows, columns, and simple math formulas. Practice sorting lists and making quick pie charts.
- Step 2: Learn Simple Database Commands Databases hold millions of facts neatly. Learn basic search words to pull out the exact rows you want.
- Step 3: Make Interactive Dashboards Put your favorite charts together on one screen. This helps other people click around and explore the clues.
- Step 4: Practice on Fresh Datasets Grab real numbers about sports, weather, or movies. Build your own fun portfolio to show off your skills.
FAQ Section
- Do I need hard math to start data analytics? No, you only need basic adding, subtracting, and sorting skills. The computer does all the heavy math for you.
- Can kids or beginners build these projects? Yes, anyone who likes solving puzzles can build these fun projects. You can start with simple sheets about your favorite movies.
- Why do analysts clean data so often? Messy data leads to false conclusions and bad business moves. Cleaning data keeps all your facts true and honest.
- What is the best way to practice? Pick a topic you love, like video games or sports. Then, collect facts and build small charts to show your friends.
Final Summary
Learning data analytics does not have to be scary or boring. You can turn messy numbers into bright stories with just a few basic steps. By practicing on simple projects, you learn how to clean facts, spot hidden trends, and build fun charts. Start with easy tools, ask great questions, and build your skills one step at a time!



Top comments (0)