some key applications of Livewire Charts
Benefits of Using Livewire Charts
Different type of charts used using livewire-charts
Renders dynamic data from database using livewire charts
Livewire Charts provide a powerful and interactive way to visualize data in real-time within Laravel applications. Below are
some key applications of Livewire Charts
- Business Dashboards Application:
Sales Analysis: Display monthly, quarterly, and yearly sales data.
Customer Demographics: Visualize customer age groups, locations, and preferences.
Revenue Trends: Show revenue growth or decline over different periods.
Example:
A bar chart displaying sales data by region or a line chart showing sales trends over the past year.
- Monitoring and Analytics Application:
System Health Monitoring: Track CPU, memory usage, and disk space over time.
User Activity: Monitor active users, login times, and user interactions.
Application Performance: Measure response times, error rates, and uptime.
Example:
An area chart showing CPU usage over the last 24 hours or a line chart tracking user activity throughout the day.
- Financial Reports Application:
Expense Tracking: Break down expenses by category.
Budget vs. Actuals: Compare budgeted amounts to actual spending.
Profit and Loss: Visualize profits and losses over time.
Example:
A pie chart showing the distribution of expenses or a bar chart comparing budgeted versus actual expenses.
- E-commerce Analytics Application:
Product Performance: Track sales of different products.
Customer Behavior: Analyze customer purchase patterns and behaviors.
Inventory Management: Monitor stock levels and predict shortages.
Example:
A donut chart showing the best-selling products or a bar chart displaying stock levels for various items.
- Educational Platforms Application:
Student Performance: Visualize grades and progress over time.
Course Enrollment: Track enrollment numbers across different courses.
Feedback Analysis: Show feedback ratings and comments.
Example:
A line chart showing student grades over the semester or a pie chart illustrating course enrollment distribution.
- Health and Fitness Application:
Health Metrics: Track metrics like weight, heart rate, and blood pressure.
Workout Statistics: Visualize workout duration, intensity, and frequency.
Diet Tracking: Monitor calorie intake and nutrition breakdown.
Example:
An area chart showing weight loss progress over time or a bar chart displaying weekly workout statistics.
- Project Management Application:
Task Progress: Track the completion of tasks and milestones.
Resource Allocation: Visualize resource usage across different projects.
Team Performance: Measure team productivity and efficiency.
Example:
A radar chart showing the skills and performance levels of team members or a line chart tracking project milestones.
Benefits of Using Livewire Charts
Real-Time Updates: Livewire Charts can automatically update as new data is added, providing real-time insights.
Interactivity: Charts are interactive, allowing users to hover over data points for more information.
Customization: Easily customize colors, titles, and labels to fit the specific needs of your application.
Integration: Seamlessly integrates with Laravel and Livewire, making it easy to fetch and display data from your database.
User Experience: Enhances the user experience by providing visually appealing and easy-to-understand data visualizations.
Example Code for Different Charts
Bar Chart Example
public function render()
{
    $data = YourModel::all();

    $columnChartModel = $data->reduce(function ($columnChartModel, $item) {
        return $columnChartModel->addColumn($item->name, $item->value, '#color');
    }, (new ColumnChartModel())->setTitle('Your Title'));

    return view('livewire.your-view', ['columnChartModel' => $columnChartModel]);
}
Line Chart Example
public function render()
{
    $data = YourModel::all();

    $lineChartModel = $data->reduce(function ($lineChartModel, $item) {
        return $lineChartModel->addPoint($item->name, $item->value);
    }, (new LineChartModel())->setTitle('Your Title'));

    return view('livewire.your-view', ['lineChartModel' => $lineChartModel]);
}
Pie Chart Example
public function render()
{
    $data = YourModel::all();

    $pieChartModel = $data->reduce(function ($pieChartModel, $item) {
        return $pieChartModel->addSlice($item->name, $item->value, '#color');
    }, (new PieChartModel())->setTitle('Your Title'));

    return view('livewire.your-view', ['pieChartModel' => $pieChartModel]);
}
Different type of charts used using livewire-charts
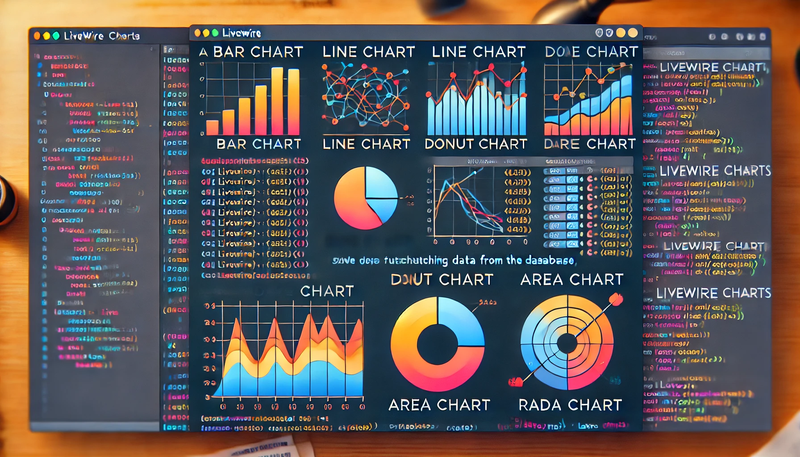
Livewire Charts offers a variety of charts that can be used in your Laravel application to display data interactively. Below are examples of different types of charts you can create with Livewire Charts along with the necessary code examples.
Livewire Charts provides a variety of chart types, including:
Bar Charts
Line Charts
Pie Charts
Donut Charts
Area Charts
Radar Charts
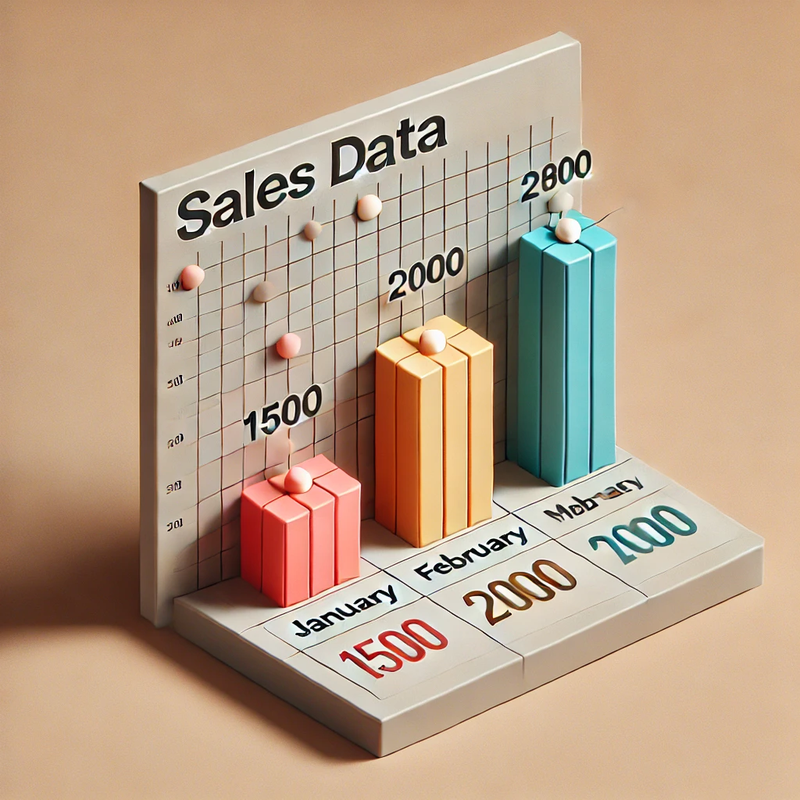
- Bar Chart Example of a Bar Chart:
Livewire Component
namespace App\Http\Livewire;

use Livewire\Component;
use Asciisd\LivewireCharts\Models\ColumnChartModel;

class BarChartComponent extends Component
{
    public function render()
    {
        $columnChartModel = (new ColumnChartModel())
            ->setTitle('Sales Data')
            ->addColumn('January', 1500, '#f6ad55')
            ->addColumn('February', 2000, '#fc8181')
            ->addColumn('March', 1800, '#90cdf4');

        return view('livewire.bar-chart-component', [
            'columnChartModel' => $columnChartModel
        ]);
    }
}
Blade View
<!-- resources/views/livewire/bar-chart-component.blade.php -->
<div>
    <livewire:livewire-column-chart :column-chart-model="$columnChartModel"/>
</div>
- Line Chart Example of a Line Chart:
Livewire Component
// app/Http/Livewire/LineChartComponent.php
namespace App\Http\Livewire;

use Livewire\Component;
use Asciisd\LivewireCharts\Models\LineChartModel;

class LineChartComponent extends Component
{
    public function render()
    {
        $lineChartModel = (new LineChartModel())
            ->setTitle('Sales Trend')
            ->addPoint('January', 1500)
            ->addPoint('February', 2000)
            ->addPoint('March', 1800);

        return view('livewire.line-chart-component', [
            'lineChartModel' => $lineChartModel
        ]);
    }
}
Blade View
<!-- resources/views/livewire/line-chart-component.blade.php -->
<div>
    <livewire:livewire-line-chart :line-chart-model="$lineChartModel"/>
</div>
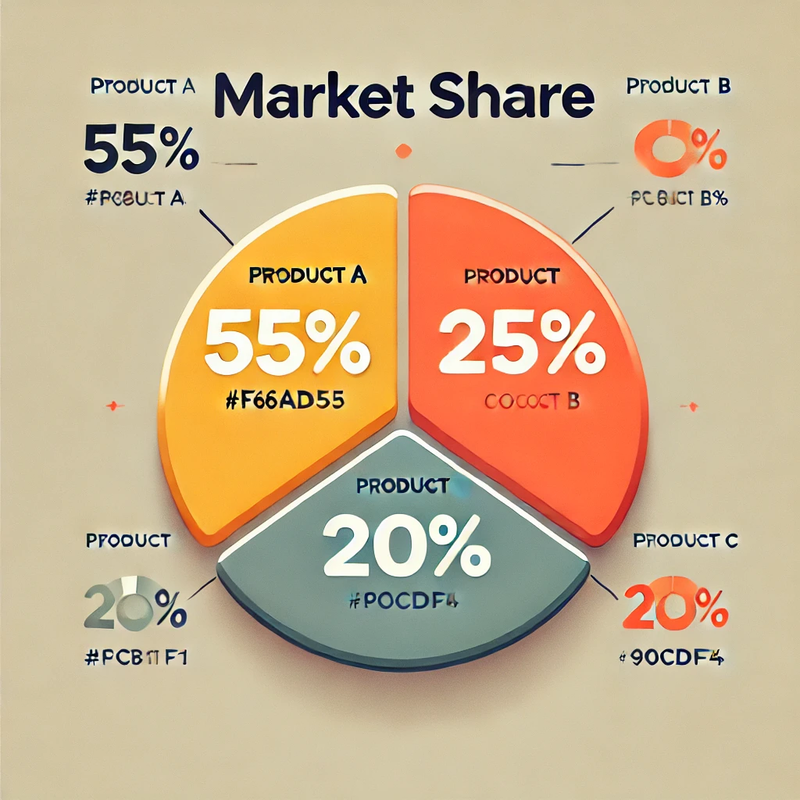
- Pie Chart Example of a Pie Chart:
Livewire Component
// app/Http/Livewire/PieChartComponent.php
namespace App\Http\Livewire;

use Livewire\Component;
use Asciisd\LivewireCharts\Models\PieChartModel;

class PieChartComponent extends Component
{
    public function render()
    {
        $pieChartModel = (new PieChartModel())
            ->setTitle('Market Share')
            ->addSlice('Product A', 55, '#f6ad55')
            ->addSlice('Product B', 25, '#fc8181')
            ->addSlice('Product C', 20, '#90cdf4');

        return view('livewire.pie-chart-component', [
            'pieChartModel' => $pieChartModel
        ]);
    }
}
Blade View
<!-- resources/views/livewire/pie-chart-component.blade.php -->
<div>
    <livewire:livewire-pie-chart :pie-chart-model="$pieChartModel"/>
</div>
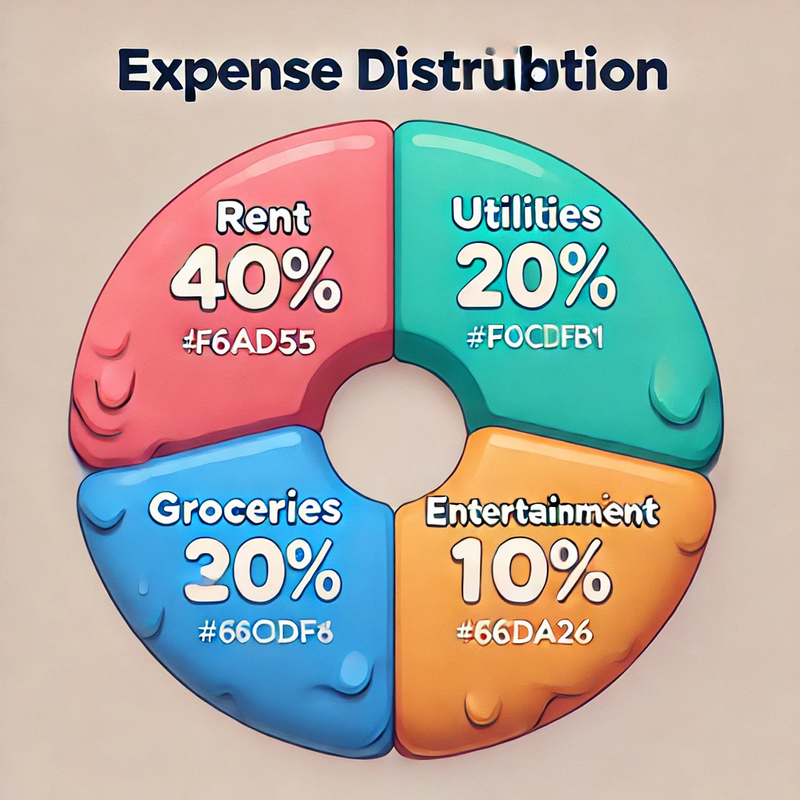
- Donut Chart Example of a Donut Chart:
Livewire Component
// app/Http/Livewire/DonutChartComponent.php
namespace App\Http\Livewire;

use Livewire\Component;
use Asciisd\LivewireCharts\Models\DonutChartModel;

class DonutChartComponent extends Component
{
    public function render()
    {
        $donutChartModel = (new DonutChartModel())
            ->setTitle('Expense Distribution')
            ->addSlice('Rent', 40, '#f6ad55')
            ->addSlice('Utilities', 20, '#fc8181')
            ->addSlice('Groceries', 30, '#90cdf4')
            ->addSlice('Entertainment', 10, '#66DA26');

        return view('livewire.donut-chart-component', [
            'donutChartModel' => $donutChartModel
        ]);
    }
}
Blade View
<!-- resources/views/livewire/donut-chart-component.blade.php -->
<div>
    <livewire:livewire-donut-chart :donut-chart-model="$donutChartModel"/>
</div>
- Area Chart Example of an Area Chart:
Livewire Component
// app/Http/Livewire/AreaChartComponent.php
namespace App\Http\Livewire;

use Livewire\Component;
use Asciisd\LivewireCharts\Models\AreaChartModel;

class AreaChartComponent extends Component
{
    public function render()
    {
        $areaChartModel = (new AreaChartModel())
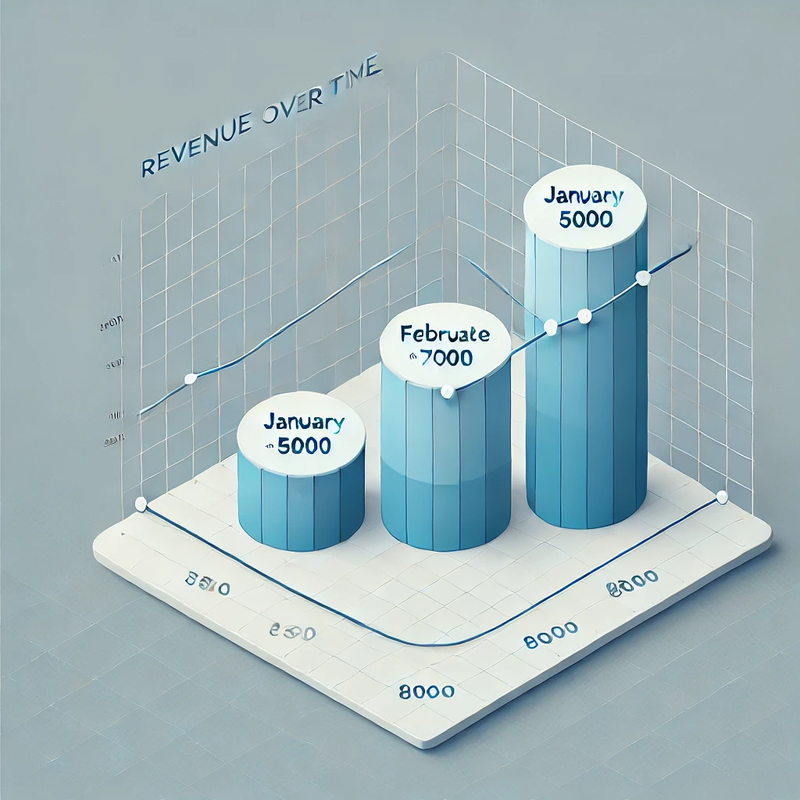
            ->setTitle('Revenue Over Time')
            ->addPoint('January', 5000)
            ->addPoint('February', 7000)
            ->addPoint('March', 8000);

        return view('livewire.area-chart-component', [
            'areaChartModel' => $areaChartModel
        ]);
    }
}
Blade View
<!-- resources/views/livewire/area-chart-component.blade.php -->
<div>
    <livewire:livewire-area-chart :area-chart-model="$areaChartModel"/>
</div>
- Radar Chart Example of a Radar Chart:
Livewire Component
// app/Http/Livewire/RadarChartComponent.php
namespace App\Http\Livewire;

use Livewire\Component;
use Asciisd\LivewireCharts\Models\RadarChartModel;

class RadarChartComponent extends Component
{
    public function render()
    {
        $radarChartModel = (new RadarChartModel())
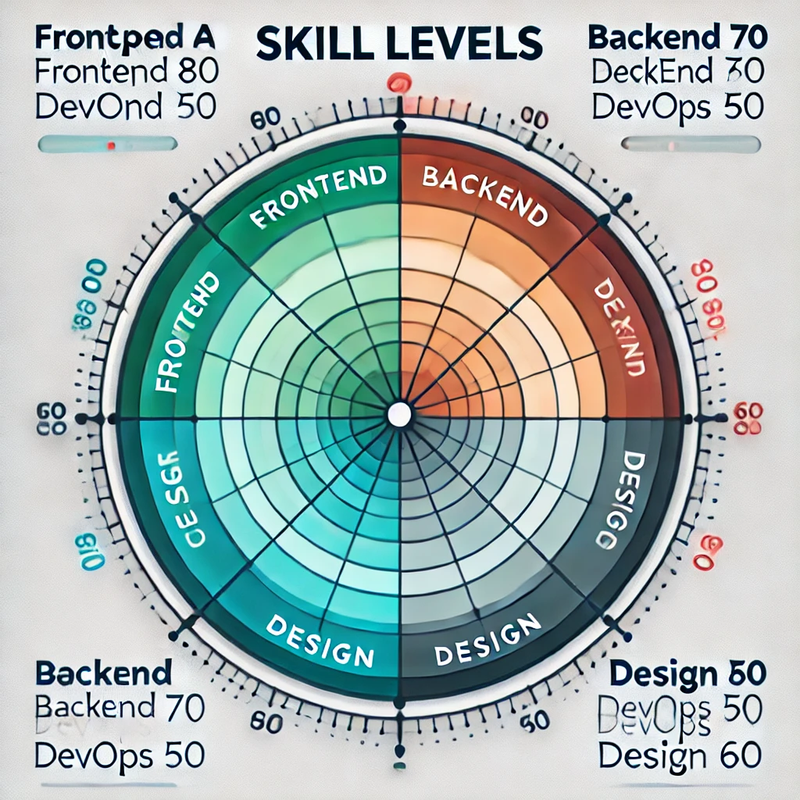
            ->setTitle('Skill Levels')
            ->addSeries('Developer A', [
                'Frontend' => 80,
                'Backend' => 70,
                'DevOps' => 50,
                'Design' => 60
            ])
            ->addSeries('Developer B', [
                'Frontend' => 60,
                'Backend' => 80,
                'DevOps' => 70,
                'Design' => 50
            ]);

        return view('livewire.radar-chart-component', [
            'radarChartModel' => $radarChartModel
        ]);
    }
}
Blade View
<!-- resources/views/livewire/radar-chart-component.blade.php -->
<div>
    <livewire:livewire-radar-chart :radar-chart-model="$radarChartModel"/>
</div>
Renders dynamic data from database using livewire charts
Prerequisites
Set up your Laravel project (if not already done).
Install Livewire (if not already done):
composer require livewire/livewire
Install Livewire Charts (if not already done):
composer require asciisd/laravel-livewire-charts
Fetching Data:
$data = YourModel::all();
This line retrieves all records from the YourModel table.
Building the Column Chart Model:
$columnChartModel = $data->reduce(function ($columnChartModel, $item) {
    return $columnChartModel->addColumn($item->name, $item->value, '#color');
}, (new ColumnChartModel())->setTitle('Your Title'));
The reduce method iterates over the collection of data.
For each item, it adds a column to the ColumnChartModel with the name, value, and a color.
The chart is titled 'Your Title'.
Returning the View:
return view('livewire.your-view', ['columnChartModel' => $columnChartModel]);
This line returns the livewire.your-view view, passing the columnChartModel to it.
Full code
// Livewire Component Method for Rendering a Column Chart
public function render()
{
    // Fetch all data from YourModel
    $data = YourModel::all();

    // Reduce the data to build the column chart model
    $columnChartModel = $data->reduce(function ($columnChartModel, $item) {
        // Add each item as a column in the chart
        return $columnChartModel->addColumn($item->name, $item->value, '#color');
    }, (new ColumnChartModel())->setTitle('Your Title'));

    // Return the view with the column chart model
    return view('livewire.your-view', ['columnChartModel' => $columnChartModel]);
}
-
Bar Chart
Livewire Component
// app/Http/Livewire/BarChartComponent.php
namespace App\Http\Livewire;

use Livewire\Component;
use App\Models\QualityState;
use Asciisd\LivewireCharts\Models\ColumnChartModel;

class BarChartComponent extends Component
{
    public function render()
    {
        $qualityStates = QualityState::all();

        $columnChartModel = $qualityStates->reduce(function ($columnChartModel, $data) {
            return $columnChartModel->addColumn($data->state, $data->value, $this->getColor($data->state));
        }, (new ColumnChartModel())
            ->setTitle('Quality State Report')
            ->setAnimated(true)
            ->withOnColumnClickEvent('onColumnClick')
            ->setLegendVisibility(false)
            ->setXAxisVisible(true)
            ->setGridVisible(true));

        return view('livewire.bar-chart-component', [
            'columnChartModel' => $columnChartModel
        ]);
    }

    protected function getColor($state)
    {
        $colors = [
            'Excellent' => '#4CAF50',
            'Good' => '#8BC34A',
            'Average' => '#FFC107',
            'Poor' => '#FF9800',
            'Bad' => '#F44336',
        ];

        return $colors[$state] ?? '#607D8B';
    }
}
Blade View
<!-- resources/views/livewire/bar-chart-component.blade.php -->
<div>
    <livewire:livewire-column-chart :column-chart-model="$columnChartModel"/>
</div>
-
Line Chart
Livewire Component
// app/Http/Livewire/LineChartComponent.php
namespace App\Http\Livewire;

use Livewire\Component;
use App\Models\QualityState;
use Asciisd\LivewireCharts\Models\LineChartModel;

class LineChartComponent extends Component
{
    public function render()
    {
        $qualityStates = QualityState::all();

        $lineChartModel = $qualityStates->reduce(function ($lineChartModel, $data) {
            return $lineChartModel->addPoint($data->state, $data->value);
        }, (new LineChartModel())
            ->setTitle('Quality State Trends')
            ->setAnimated(true)
            ->withOnPointClickEvent('onPointClick'));

        return view('livewire.line-chart-component', [
            'lineChartModel' => $lineChartModel
        ]);
    }
}
Blade View
<!-- resources/views/livewire/line-chart-component.blade.php -->
<div>
    <livewire:livewire-line-chart :line-chart-model="$lineChartModel"/>
</div>
-
Pie Chart
Livewire Component
// app/Http/Livewire/PieChartComponent.php
namespace App\Http\Livewire;

use Livewire\Component;
use App\Models\QualityState;
use Asciisd\LivewireCharts\Models\PieChartModel;

class PieChartComponent extends Component
{
    public function render()
    {
        $qualityStates = QualityState::all();

        $pieChartModel = $qualityStates->reduce(function ($pieChartModel, $data) {
            return $pieChartModel->addSlice($data->state, $data->value, $this->getColor($data->state));
        }, (new PieChartModel())
            ->setTitle('Market Share')
            ->setAnimated(true)
            ->withOnSliceClickEvent('onSliceClick'));

        return view('livewire.pie-chart-component', [
            'pieChartModel' => $pieChartModel
        ]);
    }

    protected function getColor($state)
    {
        $colors = [
            'Excellent' => '#4CAF50',
            'Good' => '#8BC34A',
            'Average' => '#FFC107',
            'Poor' => '#FF9800',
            'Bad' => '#F44336',
        ];

        return $colors[$state] ?? '#607D8B';
    }
}
Blade View
<!-- resources/views/livewire/pie-chart-component.blade.php -->
<div>
    <livewire:livewire-pie-chart :pie-chart-model="$pieChartModel"/>
</div>
-
Donut Chart
Livewire Component
// app/Http/Livewire/DonutChartComponent.php
namespace App\Http\Livewire;

use Livewire\Component;
use App\Models\QualityState;
use Asciisd\LivewireCharts\Models\DonutChartModel;

class DonutChartComponent extends Component
{
    public function render()
    {
        $qualityStates = QualityState::all();

        $donutChartModel = $qualityStates->reduce(function ($donutChartModel, $data) {
            return $donutChartModel->addSlice($data->state, $data->value, $this->getColor($data->state));
        }, (new DonutChartModel())
            ->setTitle('Expense Distribution')
            ->setAnimated(true)
            ->withOnSliceClickEvent('onSliceClick'));

        return view('livewire.donut-chart-component', [
            'donutChartModel' => $donutChartModel
        ]);
    }

    protected function getColor($state)
    {
        $colors = [
            'Excellent' => '#4CAF50',
            'Good' => '#8BC34A',
            'Average' => '#FFC107',
            'Poor' => '#FF9800',
            'Bad' => '#F44336',
        ];

        return $colors[$state] ?? '#607D8B';
    }
}
Blade View
<!-- resources/views/livewire/donut-chart-component.blade.php -->
<div>
    <livewire:livewire-donut-chart :donut-chart-model="$donutChartModel"/>
</div>
-
Area Chart
Livewire Component
// app/Http/Livewire/AreaChartComponent.php
namespace App\Http\Livewire;

use Livewire\Component;
use App\Models\QualityState;
use Asciisd\LivewireCharts\Models\AreaChartModel;

class AreaChartComponent extends Component
{
    public function render()
    {
        $qualityStates = QualityState::all();

        $areaChartModel = $qualityStates->reduce(function ($areaChartModel, $data) {
            return $areaChartModel->addPoint($data->state, $data->value);
        }, (new AreaChartModel())
            ->setTitle('Revenue Over Time')
            ->setAnimated(true)
            ->withOnPointClickEvent('onPointClick'));

        return view('livewire.area-chart-component', [
            'areaChartModel' => $areaChartModel
        ]);
    }
}
Blade View
<!-- resources/views/livewire/area-chart-component.blade.php -->
<div>
    <livewire:livewire-area-chart :area-chart-model="$areaChartModel"/>
</div>



Top comments (0)