Step 1: Install Matplotlib and Django
Ensure that Matplotlib and Django are installed in your Django environment. You can install them using pip:
pip install matplotlib
pip install django
Step 2: Set up your Django project and app
Create a new Django project and an app within the project if you haven't already done so. You can use the following command to create a new app:
django-admin startapp myapp
Step 3: Create a model for the plot in your app
In your app's models.py file, define a model that includes fields to store the plot image and associated data. For example:
from django.db import models

class Plot(models.Model):
    image = models.ImageField(upload_to='plots/')
    title = models.CharField(max_length=100)
# Add additional fields as needed
Step 4: Generate and format the plot
In your Django view or script, import the necessary libraries and create a function to generate and format the plot. Use the various formatting options available in Matplotlib to customize the appearance of the plot.
import matplotlib.pyplot as plt
from myapp.models import Plot

def generate_plot():
    x = [1, 2, 3, 4, 5]
    y = [1, 4, 9, 16, 25]

    fig, ax = plt.subplots()

    # Plot the data with customized attributes
    ax.plot(x, y, color='red', linestyle='dashed', marker='o', markersize=8, label='Data')

    # Set the title and axis labels
    ax.set_title('Plot Title')
    ax.set_xlabel('X-axis')
    ax.set_ylabel('Y-axis')

    # Customize other plot attributes
    ax.grid(True)  # Show grid lines
    ax.legend()    # Display legend

    # Save the plot as an image file
    image_path = 'path/to/save/plot.png'
    plt.savefig(image_path)

    # Save the plot and associated data in the database
    plot = Plot.objects.create(
        image=image_path,
        title='Plot'
    )
In the above example, after plotting the data with ax.plot(x, y), we can customize the plot attributes using various parameters:
color: Specifies the color of the line. It can take values like 'red', 'blue', 'green', etc., or hexadecimal color codes.
linestyle: Sets the line style. Options include 'solid', 'dashed', 'dotted', 'dashdot', etc.
marker: Determines the marker style for the data points. Common options are 'o' for circles, 's' for squares, 'x' for crosses, etc.
markersize: Sets the size of the markers.
label: Assigns a label to the plotted data, which can be used for the legend.
Additionally, we can use other methods to customize the plot further. In the example, we used ax.grid(True) to enable grid lines and ax.legend() to display a legend based on the assigned labels.
Step 5: Render the plot in a Django template
In your Django view, retrieve the plot and associated data from the database and pass them to the template context. Then, render the template with the plot and data.
from django.shortcuts import render
from myapp.models import Plot

def plot_view(request):
    plot = Plot.objects.first()  # Retrieve the plot from the database

    context = {'plot': plot}
    return render(request, 'myapp/plot_template.html', context)
Step 6: Create a template for displaying the plot
Create a template file named plot_template.html in your app's template directory. In the template, use the plot object to access the image URL and display the plot along with the associated data.
html
Copy code
<!DOCTYPE html>
<html>
<head>
    <title>Plot Template</title>
</head>
<body>
    <h1>{{ plot.title }}</h1>
    <img src="{{ plot.image.url }}" alt="Plot">
</body>
</html>
Step 7: Configure media settings in Django
In your project's settings.py file, configure the media settings to specify the location where the plot image will be saved.
MEDIA_URL = '/media/'
MEDIA_ROOT = os.path.join(BASE_DIR, 'media')
Step 8: Include media URLs in your project's URLs
In your project's urls.py file, include the media URLs to serve the plot image.
from django.conf import settings
from django.conf.urls.static import static

urlpatterns = [
    # ... your other URL patterns ...
] + static(settings.MEDIA_URL, document_root=settings.MEDIA_ROOT)
Step 9: Run the Django development server
Start the Django development server and visit the URL associated with the plot_view in your web browser. You should see the rendered plot along with the associated data.
python manage.py runserver
That's it! You have now generated a plot using Matplotlib, formatted it according to your preferences, saved it in the database along with associated data, and rendered it in a Django template. The plot image and data are stored in the media directory and can be accessed via the template. Customize the plot and template further as per your requirements.
Different ways to customize attributes and format plots
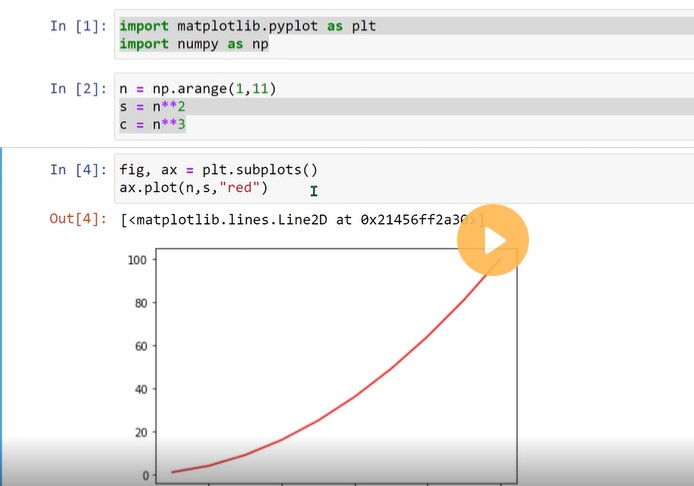
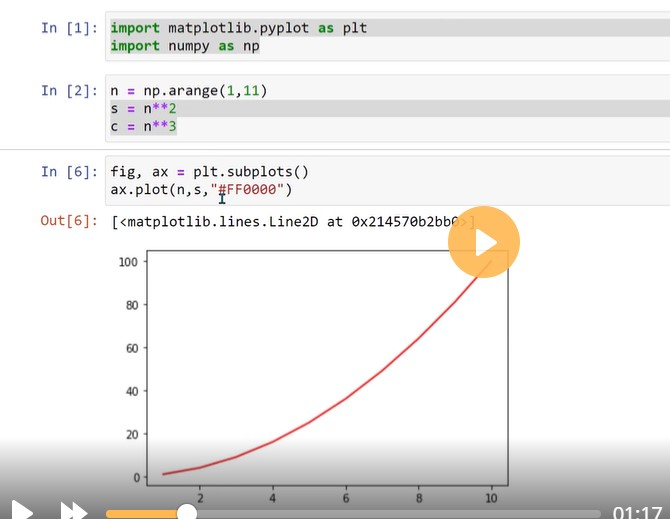
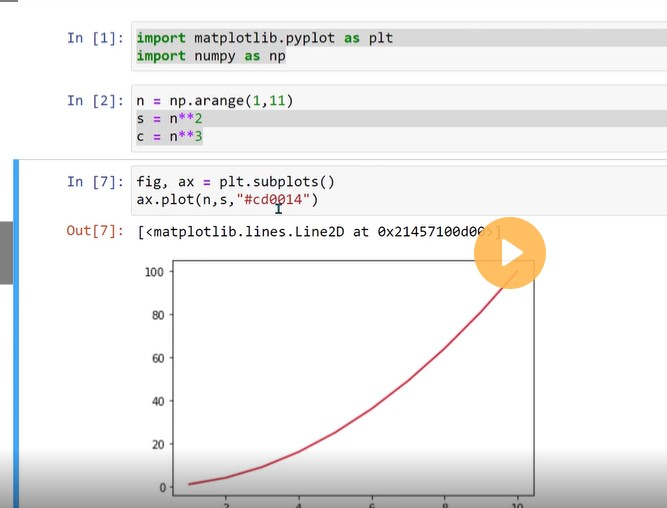
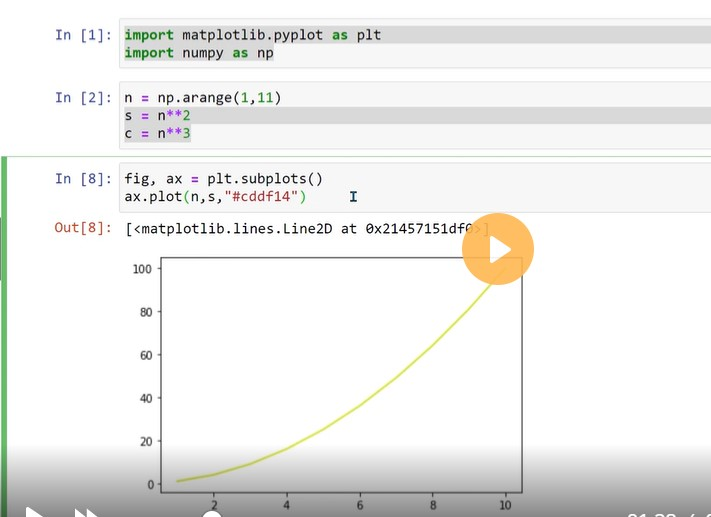
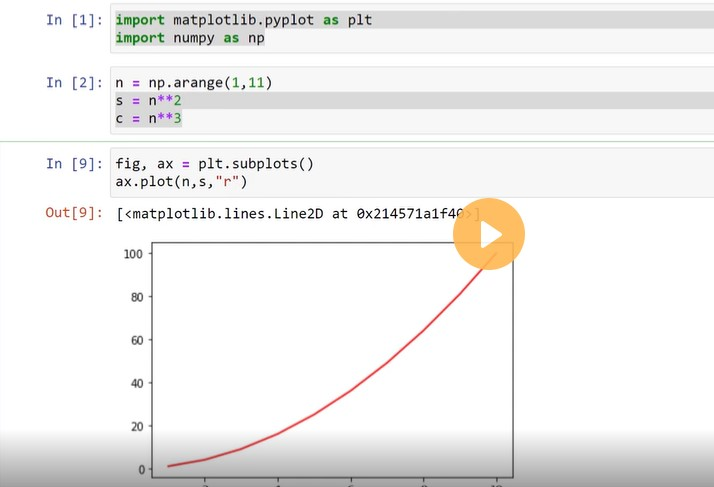
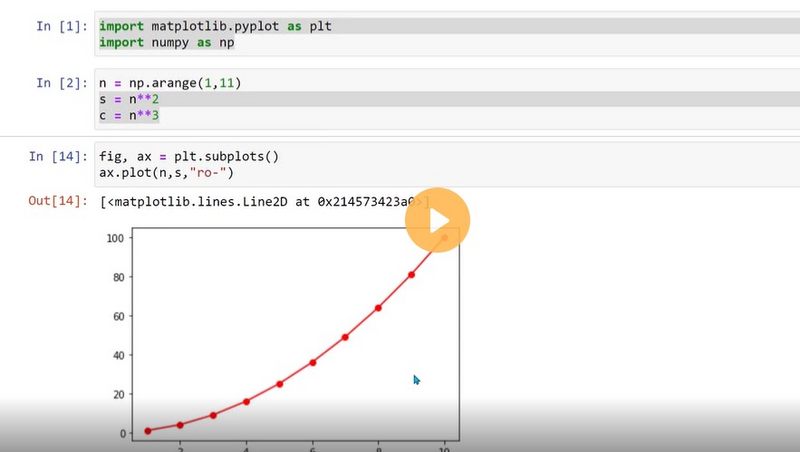
Changing Line Color:
You can specify the line color using the color parameter. It can take named colors like 'red', 'blue', 'green', or hexadecimal color codes.
import matplotlib.pyplot as plt

x = [1, 2, 3, 4, 5]
y = [1, 4, 9, 16, 25]

plt.plot(x, y, color='red')
plt.show()
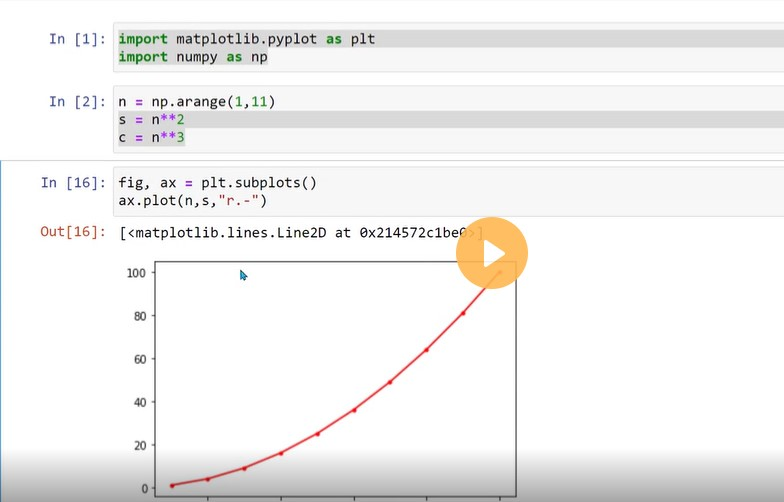
Adjusting Line Style:
The linestyle parameter determines the line style. Options include 'solid', 'dashed', 'dotted', 'dashdot', etc.
import matplotlib.pyplot as plt

x = [1, 2, 3, 4, 5]
y = [1, 4, 9, 16, 25]

plt.plot(x, y, linestyle='dashed')
plt.show()
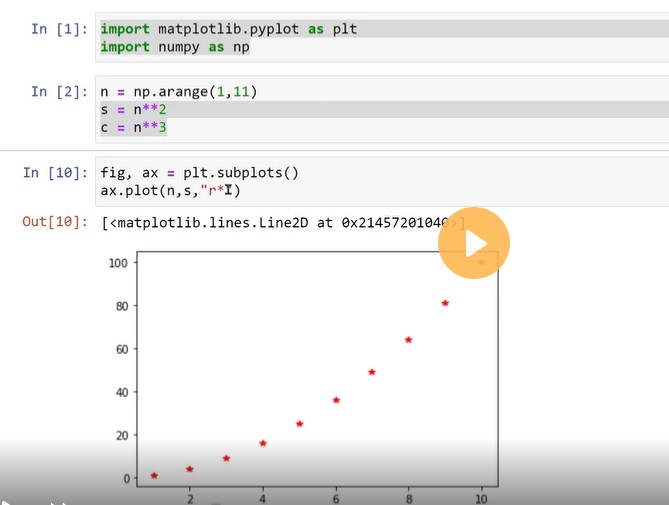
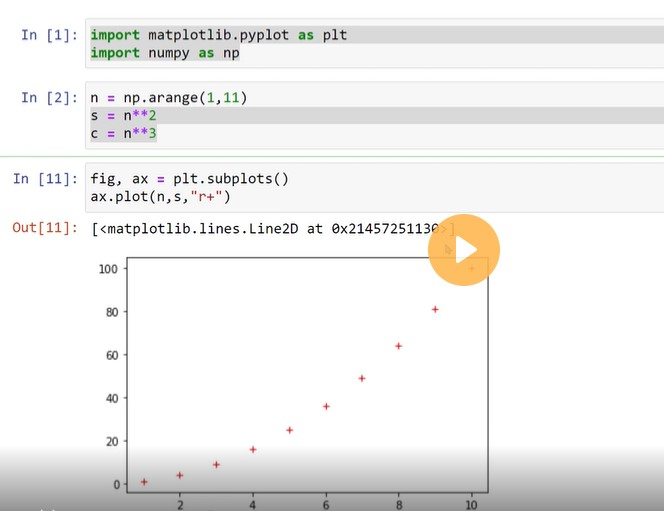
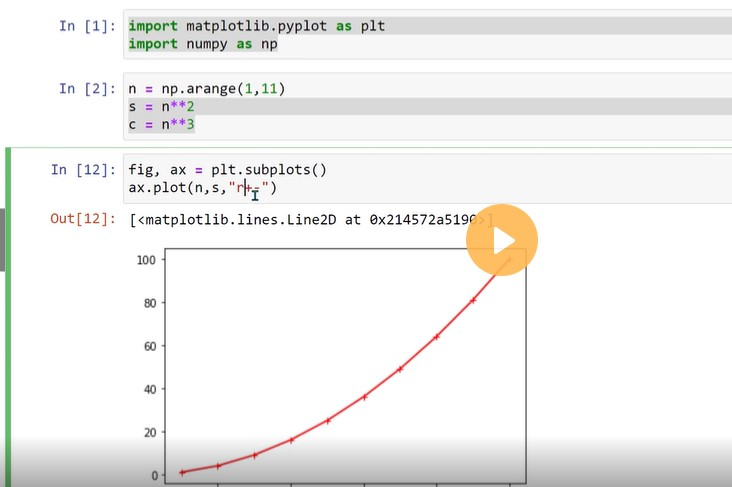
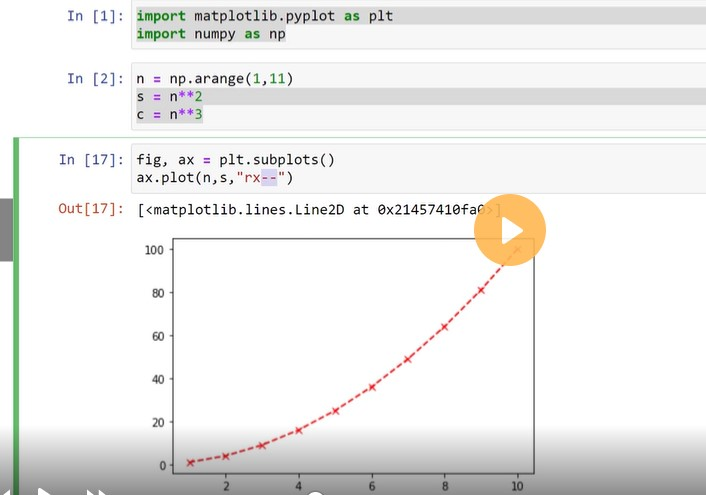
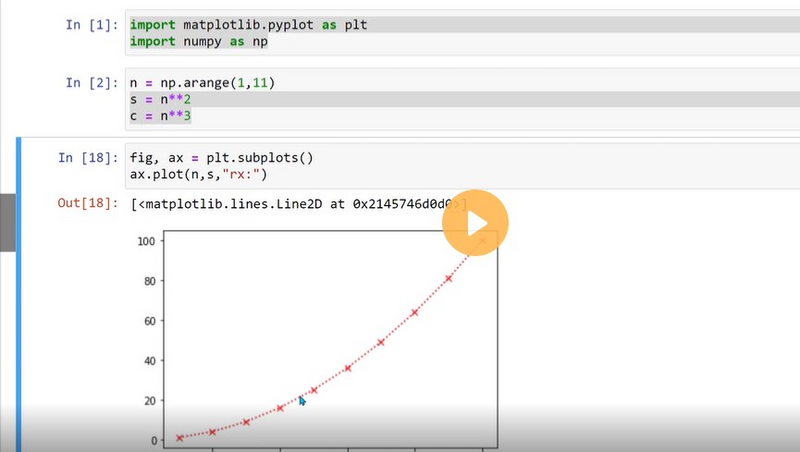
Specifying Marker Style:
To change the marker style for data points, use the marker parameter. Options include 'o' for circles, 's' for squares, 'x' for crosses, etc.
import matplotlib.pyplot as plt

x = [1, 2, 3, 4, 5]
y = [1, 4, 9, 16, 25]

plt.plot(x, y, marker='o')
plt.show()
Adjusting Marker Size:
The markersize parameter allows you to change the size of markers.
import matplotlib.pyplot as plt

x = [1, 2, 3, 4, 5]
y = [1, 4, 9, 16, 25]

plt.plot(x, y, marker='o', markersize=8)
plt.show()
Adding Labels and Title:
You can set labels for the x-axis, y-axis, and a title for the plot using the xlabel(), ylabel(), and title() functions, respectively.
import matplotlib.pyplot as plt

x = [1, 2, 3, 4, 5]
y = [1, 4, 9, 16, 25]

plt.plot(x, y)
plt.xlabel('X-axis')
plt.ylabel('Y-axis')
plt.title('Plot Title')
plt.show()
Adding Gridlines:
To display gridlines on the plot, use the grid() function. Pass True as the argument to enable gridlines.
import matplotlib.pyplot as plt

x = [1, 2, 3, 4, 5]
y = [1, 4, 9, 16, 25]

plt.plot(x, y)
plt.grid(True)
plt.show()
Modifying Axis Limits:
You can adjust the range of values displayed on the x-axis and y-axis using the xlim() and ylim() functions.
import matplotlib.pyplot as plt

x = [1, 2, 3, 4, 5]
y = [1, 4, 9, 16, 25]

plt.plot(x, y)
plt.xlim(0, 6)
plt.ylim(0, 30)
plt.show()
Displaying a Legend (continued):
import matplotlib.pyplot as plt

x = [1, 2, 3, 4, 5]
y1 = [1, 4, 9, 16, 25]
y2 = [1, 2, 4, 8, 16]

plt.plot(x, y1, label='Line 1')
plt.plot(x, y2, label='Line 2')
plt.legend()
plt.show()
Changing Plot Background and Figure Size:
To modify the background color of the plot and adjust the size of the figure, you can use the facecolor parameter for the plot and the figsize parameter for the figure.
import matplotlib.pyplot as plt

x = [1, 2, 3, 4, 5]
y = [1, 4, 9, 16, 25]

plt.figure(figsize=(8, 6), facecolor='lightgray')
plt.plot(x, y)
plt.show()
These are just a few examples of the many ways you can customize and format plots in Matplotlib. Matplotlib offers extensive flexibility in terms of customization, allowing you to tailor your plots to suit your specific requirements.
=================================================================

Top comments (0)