Step 1: Install Matplotlib and Django
Make sure you have Matplotlib and Django installed in your Python environment. You can install them using pip:
pip install matplotlib
pip install django
Step 2: Create a Django project
Create a new Django project using the following command:
django-admin startproject histogram_project
Step 3: Create a Django app
Navigate to the project directory and create a new Django app using the following command:
cd histogram_project
python manage.py startapp histogram_app
Step 4: Configure the Django settings
Open the settings.py file in your project directory and add 'histogram_app' to the INSTALLED_APPS list.
INSTALLED_APPS = [
    # other apps
    'histogram_app',
]
Step 5: Create a model for the employee data
In the models.py file inside the histogram_app directory, define a model to store the employee data. For example:
from django.db import models

class EmployeeData(models.Model):
    hire_date = models.DateField()
    employee_count = models.IntegerField()
Run the following command to apply the migrations and create the necessary database tables:
python manage.py makemigrations
python manage.py migrate
Step 6: Generate the histogram data and save it in the database
In your Django view, retrieve the employee data from the table and generate the histogram data. Here's an example:
import matplotlib.pyplot as plt
from histogram_app.models import EmployeeData
def generate_histogram(request):
# Retrieve employee data from the table
employee_data = EmployeeData.objects.all()
# Extract hire dates and employee counts from the data
hire_dates = [data.hire_date for data in employee_data]
employee_counts = [data.employee_count for data in employee_data]
# Plot the histogram
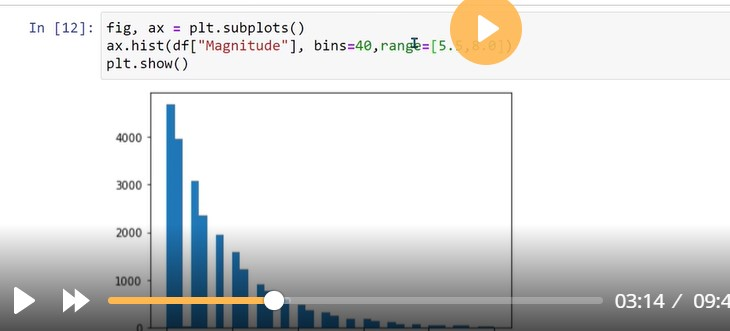
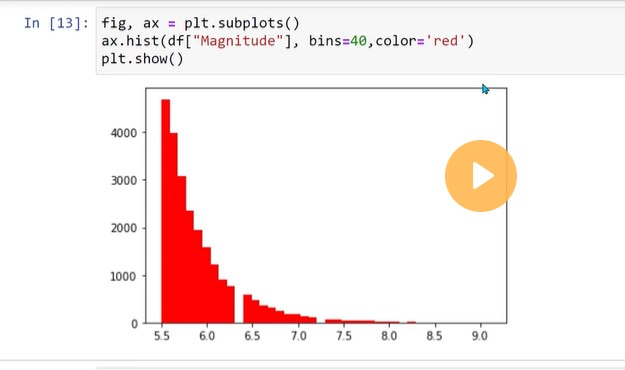
plt.hist(employee_counts, bins=10)
# Save the plot as an image file
image_path = 'path/to/save/histogram.png'
plt.savefig(image_path)
# Convert the image file to binary data
with open(image_path, 'rb') as f:
image_data = f.read()
# Save the image data in the database
histogram_data = HistogramData(data=image_data)
histogram_data.save()
return HttpResponse("Histogram generated and saved!")
Step 7: Render the histogram in a Django template
Create a Django template file (histogram.html) inside the templates directory of your app. In this template, you can render the histogram image using the image.url attribute. Here's an example:
<img src="{{ histogram_data.image.url }}" alt="Histogram">
Step 8: Define a URL pattern and view for the histogram page
In the urls.py file inside the histogram_app directory, define a URL pattern and associate it with a view function that renders the histogram template:
from django.urls import path
from histogram_app.views import generate_histogram

urlpatterns = [
    path('generate_histogram/', generate_histogram, name='generate_histogram'),
]
Step 9: Run the Django development server and access the histogram page
Start the Django development server using the following command:
python manage.py runserver 8000
===========================================================

Top comments (0)