Model evaluation in machine learning involves assessing the performance and quality of a trained model. It helps determine how well the model is likely to generalize to unseen data and provides insights into its strengths and weaknesses. Various evaluation metrics and techniques are used to measure the performance of a model. Here's an example to illustrate the model evaluation process:
Suppose we have built a binary classification model to predict whether an email is spam or not spam. We have a labeled dataset consisting of 1,000 emails, with 800 emails used for training the model and the remaining 200 emails reserved for testing.
Training the Model:
We train our binary classification model using the training dataset, which includes both the email features (e.g., subject, sender, content) and their corresponding labels (spam or not spam).
Making Predictions
Once the model is trained, we use it to make predictions on the test dataset. For each email in the test set, the model predicts whether it is spam or not spam.
Confusion Matrix
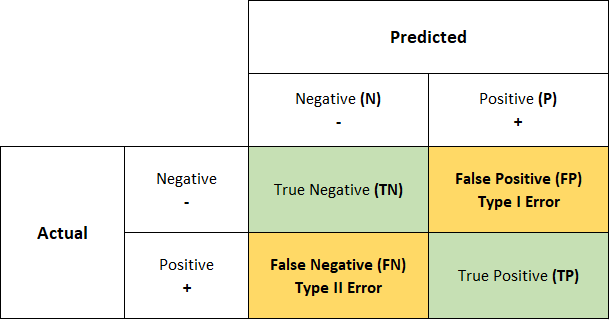
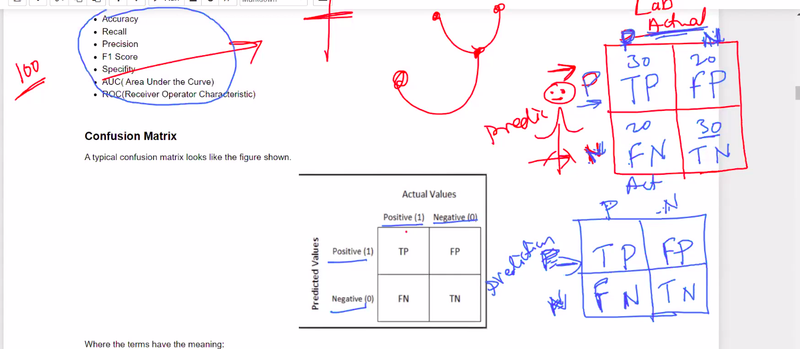
We create a confusion matrix, which is a tabulation of true positive (TP), true negative (TN), false positive (FP), and false negative (FN) predictions. It shows how well the model correctly predicts positive and negative instances.
CONFUSION MATRIX EXAMPLES
CONFUSION MATRIX==many corona +ve and -ve cases come to doctor , now doctor predidicted some positive and some -ve based on symptoms in confusion matrix row side prediction but in lab
give actual result by test blood test and other test
FP==TYPE1 ERROR
FN==TYPE2 ERROR
type2 is more dangerous because u r thinking ur corona negative because of prection/sympotoms/doctor prediction so u roaming/traveling but in lab test u found positive
symptoms==prediction
lab test result/classification model=== actual result
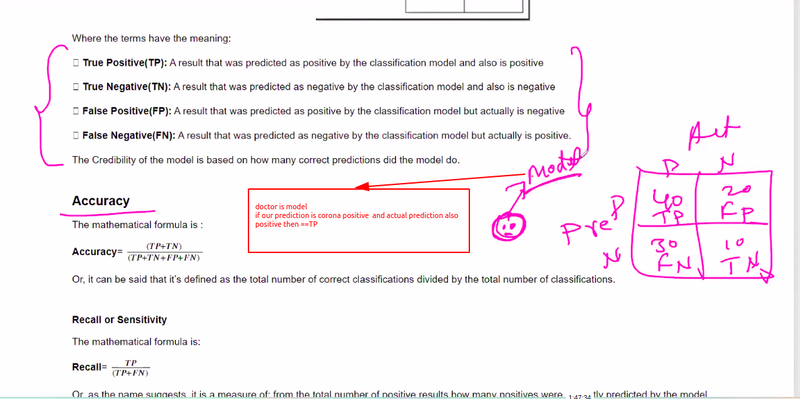
doctor is model
recall== how many positive patient out of total positive
precision== how many positive parient out of total predicted positive
FN== ultimately sign of Tp
F1 SCORE==take some part of recall and take some part of precision mixed of recall and precision
true positive rate is an example of recall
ROC== r*epresents various confusion matrix for various threshold*
if ur threshold value changes then ur confusion matrix,accuracy,recall,precison everything changes
ROC== represent multiple models they predict TPR and FPR
Evaluation Metrics
We calculate various evaluation metrics based on the confusion matrix to assess the model's performance:
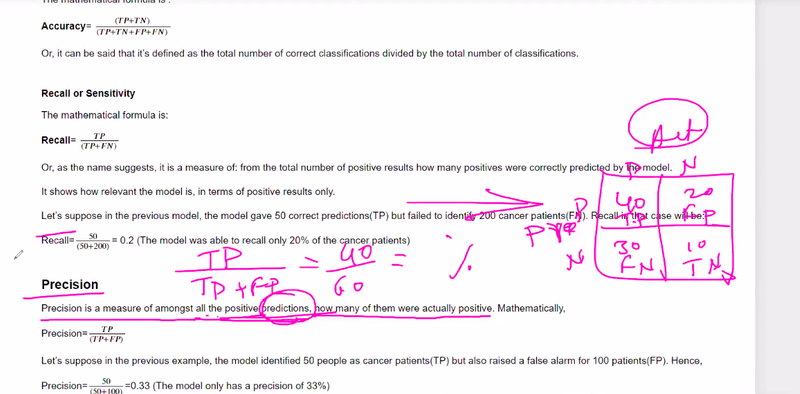
a. Accuracy: Accuracy measures the proportion of correct predictions out of the total predictions, indicating overall model performance.
b. Precision: Precision quantifies the proportion of true positive predictions out of the total predicted positive instances. It focuses on the accuracy of positive predictions.
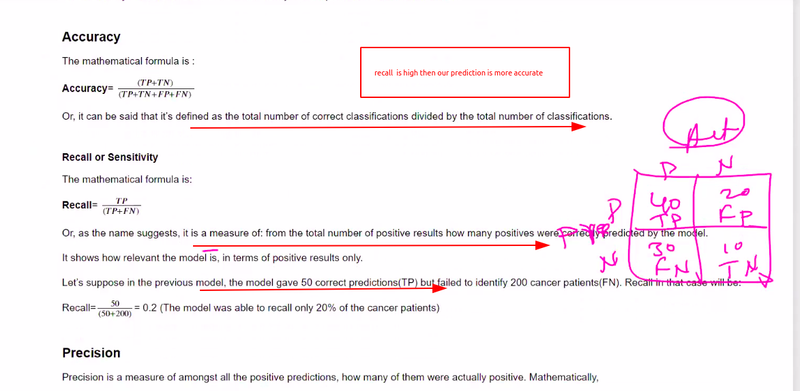
c. Recall (Sensitivity): Recall calculates the proportion of true positive predictions out of the actual positive instances. It measures the model's ability to identify all positive instances.
d. F1-Score: The F1-score is the harmonic mean of precision and recall. It provides a balanced measure of a model's accuracy in identifying positive instances.
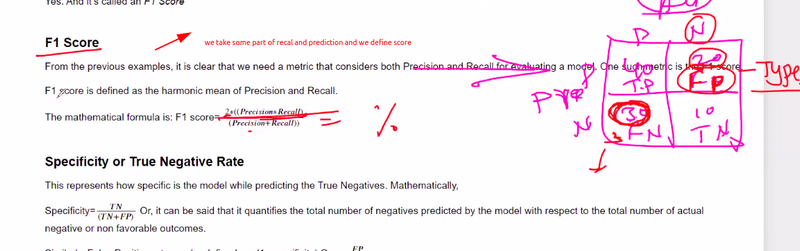
e. Specificity: Specificity calculates the proportion of true negative predictions out of the actual negative instances. It indicates the model's ability to identify negative instances correctly.
These evaluation metrics provide insights into the model's performance, considering both false positives and false negatives.
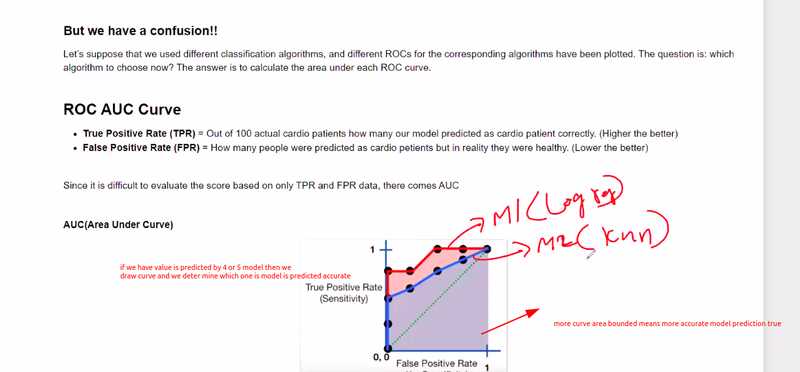
Receiver Operating Characteristic (ROC) Curve:
We plot the ROC curve, which visually represents the trade-off between true positive rate (TPR) and false positive rate (FPR) at different classification thresholds. The area under the ROC curve (AUC-ROC) is a common metric used to evaluate the model's discrimination power.
Cross-Validation:
To further evaluate the model's performance, we may perform cross-validation, a resampling technique that partitions the data into multiple subsets. We train and evaluate the model on different subsets to obtain a more robust assessment of its performance.
Comparison and Iteration:
We compare the performance of our model with other models or baseline approaches. If the model's performance is not satisfactory, we may iterate by adjusting hyperparameters, changing the model architecture, or considering feature engineering techniques.
Through this model evaluation process, we gain insights into the model's accuracy, precision, recall, F1-score, specificity, and discrimination power. This information helps us understand the model's strengths and weaknesses and make informed decisions about its suitability for deployment in real-world scenarios.
It's worth noting that the specific evaluation metrics and techniques used may vary depending on the problem domain, data characteristics, and the type of machine learning model being evaluated.
Question
model determine ?
confusion matrix is tabulation of ?
FP is which type of error?
FN is which type of error?
define recall and precision
Roc represents
F1 score is
accuracy is proportion of
recall is proportion of
Precision is proportion of
F1 score is harmonic mean of ?
ROC represents trade off
cross validation is ------- of that partition the ----------

Top comments (0)