Step 1: Install Matplotlib and Django
Make sure you have Matplotlib and Django installed in your Python environment. You can install them using pip:
pip install matplotlib
pip install django
Step 2: Create a Django project
Create a new Django project using the following command:
django-admin startproject piechart_project
Step 3: Create a Django app
Navigate to the project directory and create a new Django app using the following command:
cd piechart_project
python manage.py startapp piechart_app
Step 4: Configure the Django settings
Open the settings.py file in your project directory and add 'piechart_app' to the INSTALLED_APPS list.
INSTALLED_APPS = [
    # other apps
    'piechart_app',
]
Step 5: Create a model for the employee data
In the models.py file inside the piechart_app directory, define a model to store the employee data. For example:
from django.db import models

class EmployeeData(models.Model):
    hire_date = models.DateField()
    employee_count = models.IntegerField()
Run the following command to apply the migrations and create the necessary database tables:
python manage.py makemigrations
python manage.py migrate
Step 6: Generate the pie chart data and save it in the database
In your Django view, retrieve the employee data from the table and generate the pie chart data. Here's an example:
import matplotlib.pyplot as plt
from piechart_app.models import EmployeeData
def generate_pie_chart(request):
# Retrieve employee data from the table
employee_data = EmployeeData.objects.all()
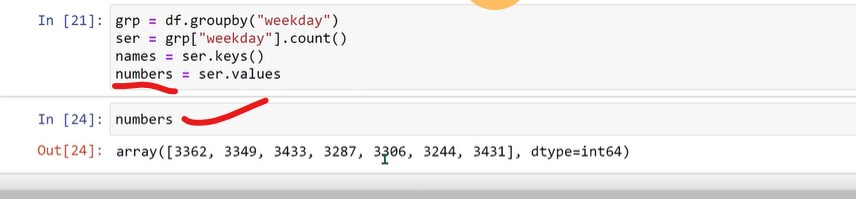
# Extract hire dates and employee counts from the data
hire_dates = [data.hire_date for data in employee_data]
employee_counts = [data.employee_count for data in employee_data]
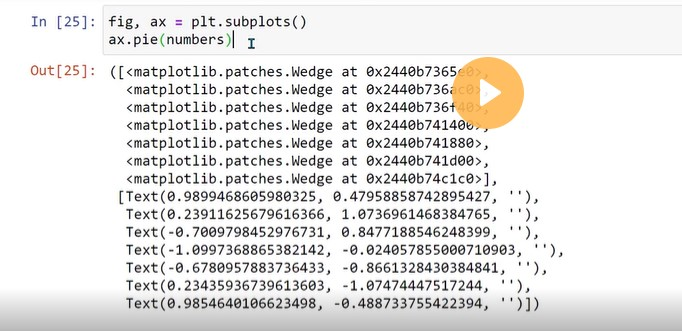
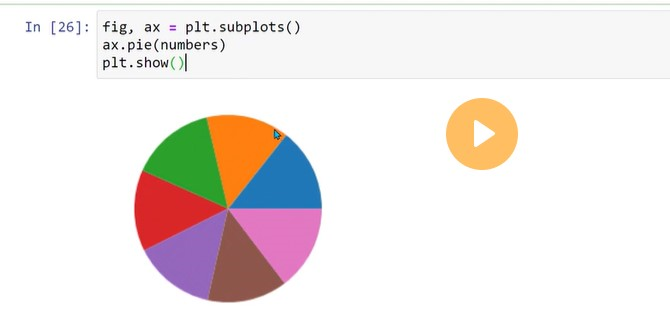
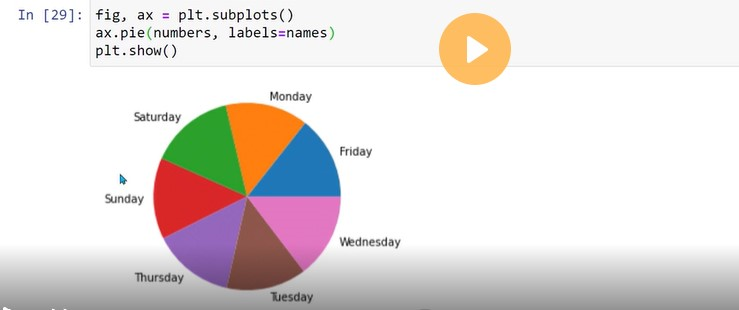
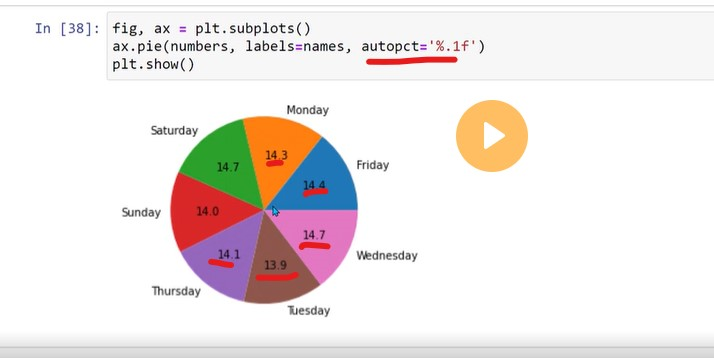
# Plot the pie chart
plt.pie(employee_counts, labels=hire_dates, autopct='%1.1f%%')
# Save the plot as an image file
image_path = 'path/to/save/piechart.png'
plt.savefig(image_path)
# Convert the image file to binary data
with open(image_path, 'rb') as f:
image_data = f.read()
# Save the image data in the database
pie_chart_data = PieChartData(data=image_data)
pie_chart_data.save()
return HttpResponse("Pie chart generated and saved!")
Step 7: Render the pie chart in a Django template
Create a Django template file (piechart.html) inside the templates directory of your app. In this template, you can render the pie chart image using the image.url attribute. Here's an example:
<img src="{{ pie_chart_data.image.url }}" alt="Pie Chart">
Step 8: Define a URL pattern and view for the pie chart page
In the urls.py file inside the piechart_app directory, define a URL pattern and associate it with a view function that renders the pie chart template:
from django.urls import path
from piechart_app.views import generate_pie_chart

urlpatterns = [
    path('generate_pie_chart/', generate_pie_chart, name='generate_pie_chart'),
]
======================================================

Top comments (0)