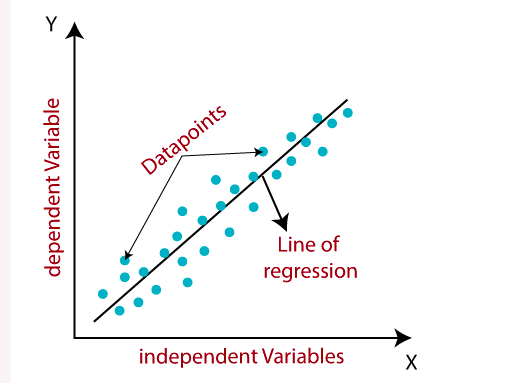
meaning of data points,regression line,dependent independent variable in diagram
meaning of classification and regression in diagram
Regression analysis is a statistical modeling technique used to explore the relationship between a dependent variable and one or more independent variables. It aims to understand how changes in the independent variables are associated with changes in the dependent variable. In machine learning, regression analysis is often used for predicting numerical or continuous outcomes.
regression gives value in term of continous 0.32,0.87,0.66
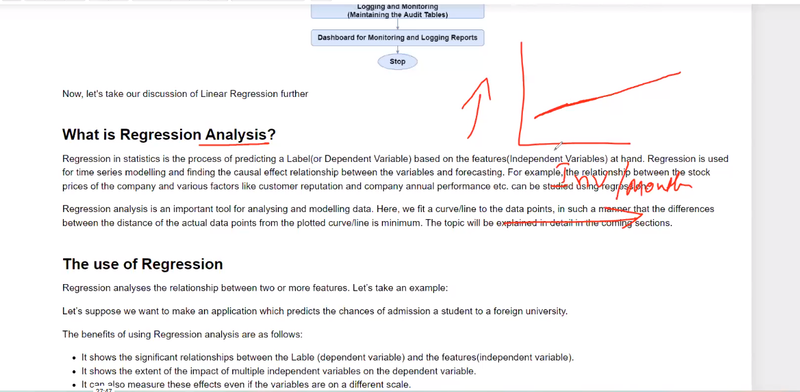
USE OF REGRESSION ANALYSIS
Regression analysis is a valuable tool in various fields for a wide range of applications. Here are some key points highlighting the use of regression analysis:
Relationship Exploration: Regression analysis allows us to explore and quantify the relationship between variables. It helps determine how changes in one variable affect another, enabling us to understand the direction, strength, and significance of the relationship.
Prediction and Forecasting: Regression models can be used to predict or forecast future values of a dependent variable based on the values of independent variables. By analyzing historical data, the model can make predictions and estimate future outcomes.
Variable Importance: Regression analysis helps identify the important independent variables that have a significant impact on the dependent variable. The coefficients in the regression equation indicate the magnitude and direction of the relationship between the variables, allowing us to prioritize and focus on influential factors.
Decision Making: Regression analysis provides insights that aid decision-making processes. By understanding the relationships between variables, we can make informed choices about resource allocation, investment decisions, pricing strategies, and other business-related decisions.
Control and Optimization: Regression analysis can be used to identify the factors that affect a specific outcome and control or optimize those factors. By manipulating the independent variables, we can determine the optimal settings to achieve the desired outcome.
Model Validation: Regression analysis helps evaluate and validate models by comparing predicted values with actual observed values. By assessing the model's accuracy and precision, we can determine its usefulness and reliability for future predictions.
Outlier Detection: Regression analysis can help identify outliers, which are data points that deviate significantly from the general pattern. Outliers may indicate unusual observations or errors in data collection, and their detection allows for further investigation or data correction.
Trend Analysis: Regression analysis can analyze trends over time. By examining the relationship between variables across different time periods, we can identify patterns, cyclical behaviors, or long-term trends that can inform future planning and decision-making.
Model Comparison: Regression analysis enables the comparison of different models or variations of models. By evaluating the fit, accuracy, and statistical significance of different models, we can select the most appropriate model for a specific problem or research question.
Assumptions and Limitations: Regression analysis requires certain assumptions to be met for accurate results. Understanding these assumptions and limitations is crucial to interpret the analysis correctly and avoid potential pitfalls.
Here's an example to illustrate regression analysis in machine learning:
Suppose we have a dataset of houses with various features such as size (in square feet), number of bedrooms, and location. We also have information about the corresponding sale prices of these houses. We want to build a regression model that can predict the sale price based on the given features.
Data Preparation:
We start by preparing our data. The dataset consists of observations or instances (houses) and their corresponding features (size, number of bedrooms, location) and target variable (sale price). We split the data into two parts: a training set and a test set.
Model Selection:
Next, we select a regression model suitable for our problem. Common regression models include linear regression, polynomial regression, and regression using machine learning algorithms such as decision trees or random forests.
Model Training:
We train the regression model using the training data. The model learns the relationship between the independent variables (features) and the dependent variable (sale price) based on the training examples.
Model Evaluation:
Once the model is trained, we evaluate its performance on the test data. We assess how well the model predicts the sale prices of the houses in the test set by comparing the predicted prices with the actual prices.
Model Deployment:
After evaluating the model's performance, we can deploy it to make predictions on new, unseen data. We can use the trained model to predict the sale price of a new house based on its features.
Regression analysis allows us to understand the impact of each independent variable on the dependent variable. For example, we can determine how much the sale price of a house changes for every square foot increase in size, or for each additional bedroom.
The regression model aims to find the best-fit line or curve that minimizes the difference between the predicted and actual values. The coefficients or parameters of the regression equation provide insights into the strength and direction of the relationship between the variables.
Regression analysis is widely used in various fields, including finance, economics, marketing, and social sciences. It helps in understanding and predicting outcomes, making informed decisions, and identifying important factors influencing a particular phenomenon.
EXAMPLE
Linear regression
Classification
Classification in machine learning is a supervised learning technique that aims to categorize or assign input data points into predefined classes or categories. It is commonly used for tasks where the outcome is discrete or categorical in nature. Classification algorithms learn from labeled training data and generalize patterns to make predictions on new, unseen data.
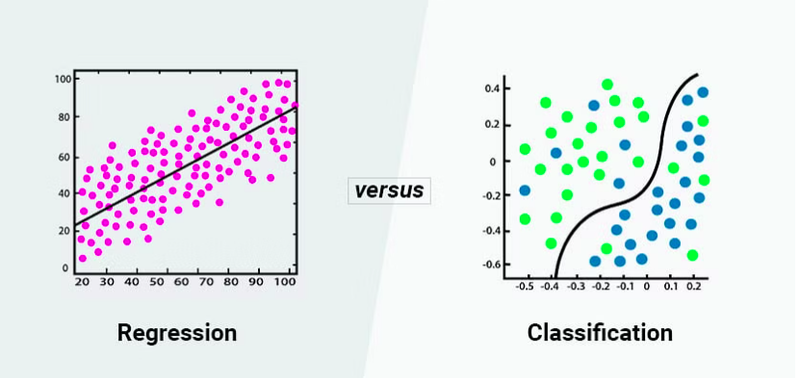
classification gives value in term of categorical term true/false, positive/negative,0/1

Top comments (0)