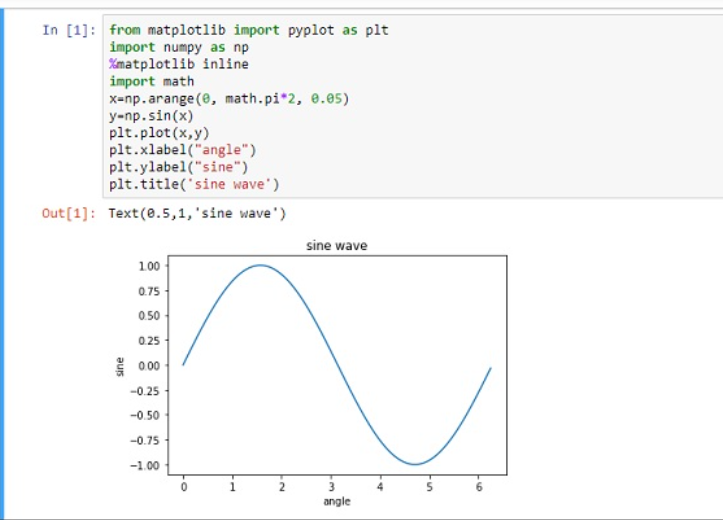
Plotting sinewave in single figure
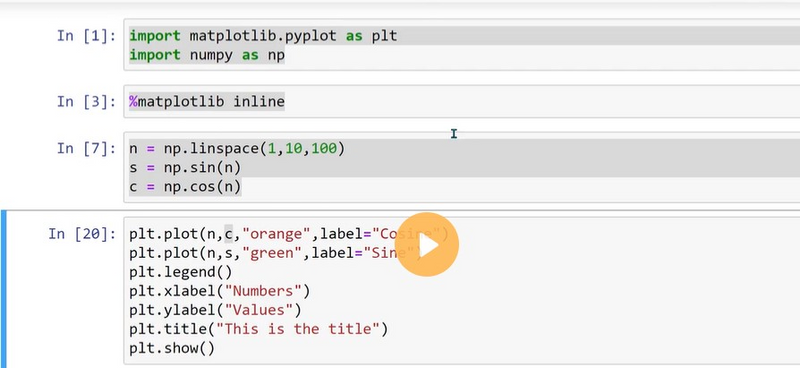
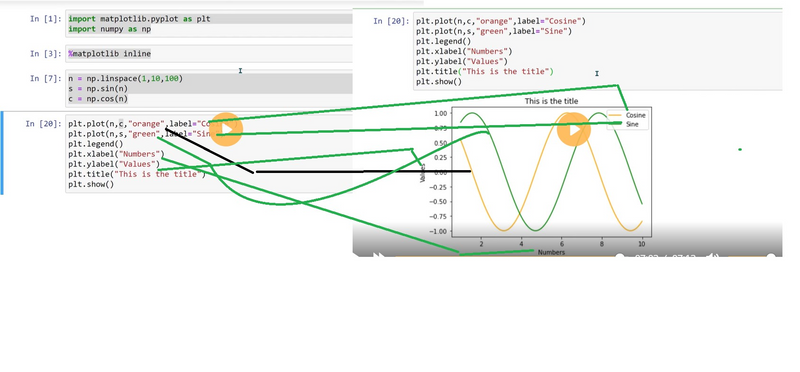
plotting two plot sinewave and cosine wave in single figure
plot the line no of student present in each class using matplotlib in django
To plot a simple line using Matplotlib, save it in a database, and render it in a Django template, you can follow these steps:
Step 1: Install Matplotlib and Django
Ensure that Matplotlib and Django are installed in your Django environment. You can install them using pip:
pip install matplotlib
pip install django
Step 2: Set up your Django project and app
Create a new Django project and an app within the project if you haven't already done so. You can use the following command to create a new app:
django-admin startapp myapp
Step 3: Create a model for the plot in your app
In your app's models.py file, define a model that includes a field to store the plot image. For example:
from django.db import models

class Plot(models.Model):
    image = models.ImageField(upload_to='plots/')
Step 4: Generate the plot and save it in the database
In your Django view or script, import the necessary libraries and create a function to generate the plot. Use the function to save the plot as an image file, and then save the image in the database.
import matplotlib.pyplot as plt
import numpy as np
from myapp.models import Plot

def generate_plot():
    x = np.linspace(0, 10, 100)
    y = x

    plt.plot(x, y)
    plt.title('Simple Line Plot')
    plt.xlabel('X-axis')
    plt.ylabel('Y-axis')
    plt.grid(True)

    # Save the plot as an image file
    image_path = 'path/to/save/plot.png'
    plt.savefig(image_path)

    # Save the image path in the database
    plot = Plot.objects.create(image=image_path)
Step 5: Render the plot in a Django template
In your Django view, retrieve the plot image from the database and pass it to the template context. Then, render the template with the plot image.
from django.shortcuts import render
from myapp.models import Plot

def plot_view(request):
    plot = Plot.objects.first()  # Retrieve the plot from the database

    context = {'plot': plot}
    return render(request, 'myapp/plot_template.html', context)
Step 6: Create a template for displaying the plot
Create a template file named plot_template.html in your app's template directory. In the template, use the plot object to access the image URL and display it.
<html>
<head>
    <title>Plot Template</title>
</head>
<body>
    <h1>Plot</h1>
    <img src="{{ plot.image.url }}" alt="Line Plot">
</body>
</html>
Step 7: Configure media settings in Django
In your project's settings.py file, configure the media settings to specify the location where plot images will be saved.
MEDIA_URL = '/media/'
MEDIA_ROOT = os.path.join(BASE_DIR, 'media')
Step 8: Include media URLs in your project's URLs
In your project's urls.py file, include the media URLs to serve the plot images.
from django.conf import settings
from django.conf.urls.static import static

urlpatterns = [
    # ... your other URL patterns ...
] + static(settings.MEDIA_URL, document_root=settings.MEDIA_ROOT)
Step 9: Run the Django development server
Start the Django development server and visit the URL associated with the plot_view in your web browser. You should see the plot displayed on the page.
To run the Django development server, navigate to your project's root directory in the command line and execute the following command:
python manage.py runserver
plt.legends()
The correct function name in Matplotlib for creating legends is plt.legend(). The plt.legend() function is used to add a legend to a plot created using Matplotlib. A legend is a small area within the plot that provides information about the elements displayed on the plot, such as the meaning of different colors or line styles.
When you call plt.legend(), Matplotlib will automatically generate a legend based on the labels assigned to the different plot elements, such as lines, markers, or filled areas. By default, the legend is placed in the upper-right corner of the plot, but you can customize its position using the loc parameter.
Here's a basic example to illustrate how to use plt.legend():
import matplotlib.pyplot as plt

x = [1, 2, 3]
y1 = [4, 5, 6]
y2 = [7, 8, 9]

plt.plot(x, y1, label='Line 1')
plt.plot(x, y2, label='Line 2')

plt.legend()
plt.show()
In this example, two lines are plotted, and a legend is added to explain which line corresponds to which label. The legend will display a colored line or marker corresponding to each line on the plot, along with the associated label text.
plot the line no of student present in each class using matplotlib in django
Step 1: Install Matplotlib and Django
Make sure you have Matplotlib and Django installed in your Python environment. You can install them using pip:
pip install matplotlib
pip install django
Step 2: Create a Django project
Create a new Django project using the following command:
django-admin startproject lineplot_project
Step 3: Create a Django app
Navigate to the project directory and create a new Django app using the following command:
cd lineplot_project
python manage.py startapp lineplot_app
Step 4: Configure the Django settings
Open the settings.py file in your project directory and add 'lineplot_app' to the INSTALLED_APPS list.
INSTALLED_APPS = [
    # other apps
    'lineplot_app',
]
Step 5: Create a model for the student data
In the models.py file inside the lineplot_app directory, define a model to store the student data. For example:
from django.db import models

class StudentData(models.Model):
    class_name = models.CharField(max_length=50)
    student_count = models.IntegerField()
Run the following command to apply the migrations and create the necessary database tables:
python manage.py makemigrations
python manage.py migrate
Step 6: Generate the line plot data and save it in the database
In your Django view, retrieve the student data from the table and generate the line plot data. Here's an example:
import matplotlib.pyplot as plt
from lineplot_app.models import StudentData

def generate_line_plot(request):
    # Retrieve student data from the table
    student_data = StudentData.objects.all()

    # Extract class names and student counts from the data
    class_names = [data.class_name for data in student_data]
    student_counts = [data.student_count for data in student_data]

    # Plot the line plot
    plt.plot(class_names, student_counts)
    plt.xlabel("Class Name")
    plt.ylabel("Number of Students")

    # Save the plot as an image file
    image_path = 'path/to/save/lineplot.png'
    plt.savefig(image_path)

    # Convert the image file to binary data
    with open(image_path, 'rb') as f:
        image_data = f.read()

    # Save the image data in the database
    lineplot_data = LineplotData(data=image_data)
    lineplot_data.save()

    return HttpResponse("Line plot generated and saved!")
Step 7: Render the line plot in a Django template
Create a Django template file (lineplot.html) inside the templates directory of your app. In this template, you can render the line plot image using the image.url attribute. Here's an example:
<!-- lineplot.html -->
<img src="{{ lineplot_data.image.url }}" alt="Line Plot">
Step 8: Define a URL pattern and view for the line plot page
In the urls.py file inside the lineplot_app directory, define a URL pattern and associate it with a view function that renders the line plot template:
from django.urls import path
from lineplot_app.views import generate_line_plot

urlpatterns = [
    path('generate_line_plot/', generate_line_plot, name='generate_line_plot'),
]
Step 9: Run the Django development server and access the line plot page
Start the Django development server by running the following command:
python manage.py runserver
Access the line plot page in your web browser by navigating to http://localhost:8000/generate_line_plot/ or the corresponding URL for your development environment.


Top comments (0)