How to create multiple subplots in Matplotlib in Python?
How to Add Title to Subplots in Matplotlib?
How to Set a Single Main Title for All the Subplots in Matplotlib?
How to Turn Off the Axes for Subplots in Matplotlib?
How to Create Different Subplot Sizes in Matplotlib?
How to set the spacing between subplots in Matplotlib in Python?
How to draw multiple plot with oops approach and without oops approach
How to create multiple subplots in Matplotlib in Python?
In Matplotlib, subplots refer to dividing a single figure into multiple smaller plots. This allows you to display multiple plots within the same figure, making it easier to compare different datasets or aspects of your data. There are different ways to create subplots in Matplotlib, and one common approach is to use the plt.subplots() function.
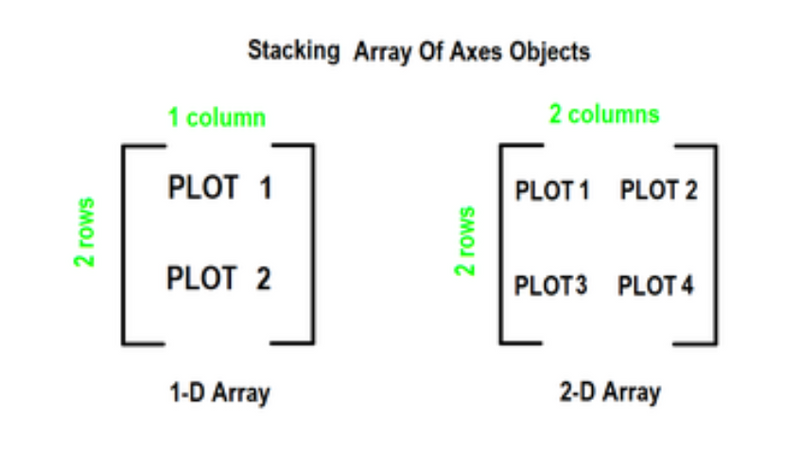
To create multiple plots use matplotlib.pyplot.subplots method which returns the figure along with Axes object or array of Axes object. nrows, ncols attributes of subplots() method determine the number of rows and columns of the subplot grid.
By default, it returns a figure with a single plot. For each axes object i.e plot we can set title (set via set_title()), an x-label (set via set_xlabel()), and a y-label set via set_ylabel()).
Let’s see how this works
- When we call the subplots() method by stacking only in one direction it returns a 1D array of axes object i.e subplots.
- We can access these axes objects using indices just like we access elements of the array. To create specific subplots, call matplotlib.pyplot.plot() on the corresponding index of the axes . Refer to the following figure for a better understanding
# importing library
import matplotlib.pyplot as plt
# Some data to display
x = [1, 2, 3]
y = [0, 1, 0]
z = [1, 0, 1]
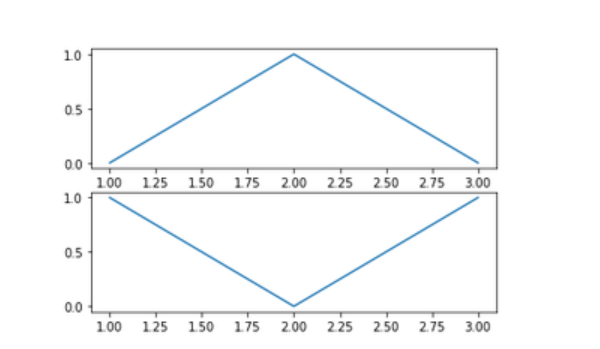
# Creating 2 subplots
fig, ax = plt.subplots(2)
# Accessing each axes object to plot the data through returned array
ax[0].plot(x, y)
ax[1].plot(x, z)
# importing library
import matplotlib.pyplot as plt
import numpy as np
# Data for plotting
x = np.arange(0.0, 2.0, 0.01)
y = 1 + np.sin(2 * np.pi * x)
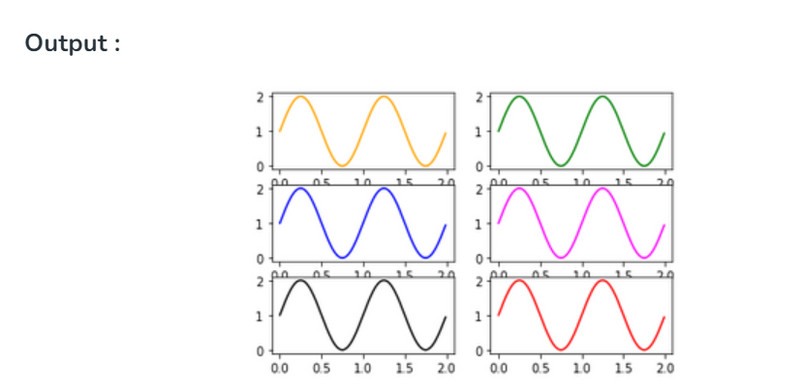
# Creating 6 subplots and unpacking the output array immediately
fig, ((ax1, ax2), (ax3, ax4), (ax5, ax6)) = plt.subplots(3, 2)
ax1.plot(x, y, color="orange")
ax2.plot(x, y, color="green")
ax3.plot(x, y, color="blue")
ax4.plot(x, y, color="magenta")
ax5.plot(x, y, color="black")
ax6.plot(x, y, color="red")
How to Add Title to Subplots in Matplotlib?
In this article, we will see how to add a title to subplots in Matplotlib? Let’s discuss some concepts :
Matplotlib : Matplotlib is an amazing visualization library in Python for 2D plots of arrays. Matplotlib is a multi-platform data visualization library built on NumPy arrays and designed to work with the broader SciPy stack. It was introduced by John Hunter in the year 2002.
Subplots : The subplots() function in pyplot module of matplotlib library is used to create a figure and a set of subplots. Subplots are required when we want to show two or more plots in same figure.
Title of a plot : The title() method in matplotlib module is used to specify title of the visualization depicted and displays the title using various attributes.
Steps Needed
Import Libraries
Create/ Load data
Make subplot
Plot subplot
Set title to subplots.
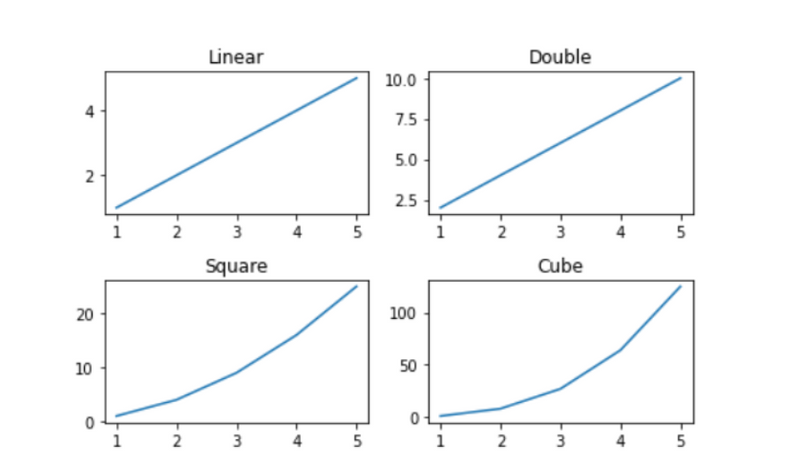
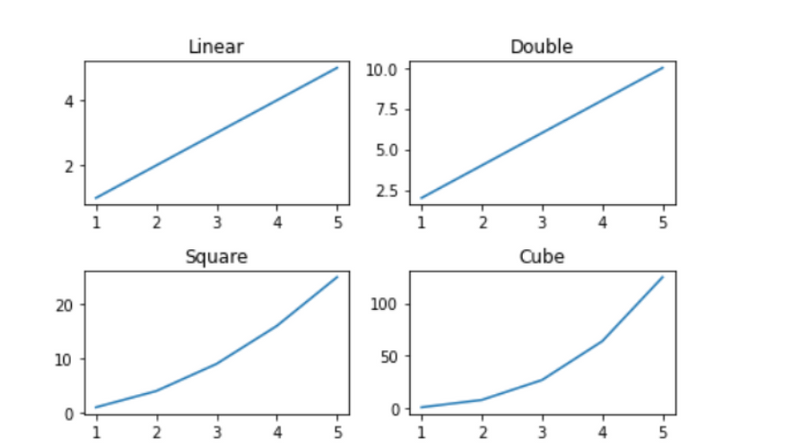
Example 1: (Using set_title() method)
We use matplotlib.axes._axes.Axes.set_title(label) method to set title (string label) for the current subplot Axes.
importing packages
import numpy as np
import matplotlib.pyplot as plt

# create data
x=np.array([1, 2, 3, 4, 5])

# making subplots
fig, ax = plt.subplots(2, 2)

# set data with subplots and plot
ax[0, 0].plot(x, x)
ax[0, 1].plot(x, x*2)
ax[1, 0].plot(x, x*x)
ax[1, 1].plot(x, x*x*x)

# set the title to subplots
ax[0, 0].set_title("Linear")
ax[0, 1].set_title("Double")
ax[1, 0].set_title("Square")
ax[1, 1].set_title("Cube")

# set spacing
fig.tight_layout()
plt.show()
Output:
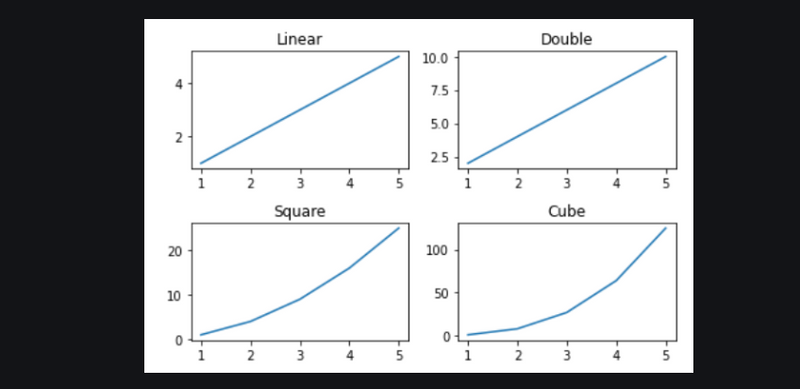
Example 2: (Using title.set_text() method)
We can also add title to subplots in Matplotlib using title.set_text() method, in similar way to set_title() method.
importing packages
import numpy as np
import matplotlib.pyplot as plt

# create data
x=np.array([1, 2, 3, 4, 5])

# making subplots
fig, ax = plt.subplots(2, 2)

# set data with subplots and plot
ax[0, 0].plot(x, x)
ax[0, 1].plot(x, x*2)
ax[1, 0].plot(x, x*x)
ax[1, 1].plot(x, x*x*x)

# set the title to subplots
ax[0, 0].title.set_text("Linear")
ax[0, 1].title.set_text("Double")
ax[1, 0].title.set_text("Square")
ax[1, 1].title.set_text("Cube")

# set spacing
fig.tight_layout()
plt.show()
Output:
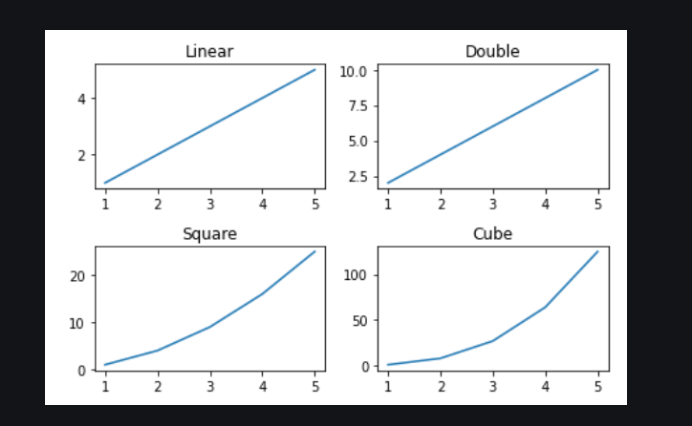
Example 3: (Using plt.gca().set_title() method)
If you use Matlab-like style in the interactive plotting, then you could use plt.gca() to get the reference of the current axes of the subplot and combine set_title() method to set title to the subplots in Matplotlib.
# importing packages
import numpy as np
import matplotlib.pyplot as plt

# create data
x=np.array([1, 2, 3, 4, 5])

# making subplots
fig, ax = plt.subplots(2, 2)

# set data with subplots and plot
title = ["Linear", "Double", "Square", "Cube"]
y = [x, x*2, x*x, x*x*x]

for i in range(4):

    # subplots
    plt.subplot(2, 2, i+1)

    # plotting (x,y)
    plt.plot(x, y[i])

    # set the title to subplots
    plt.gca().set_title(title[i])

# set spacing
fig.tight_layout()
plt.show()
(Using plt.gca().title.set_text() method)
If you use Matlab-like style in the interactive plotting, then you could use plt.gca() to get the reference of the current axes of the subplot and combine title.set_text() method to set title to the subplots in Matplotlib.
# importing packages
import numpy as np
import matplotlib.pyplot as plt

# create data
x=np.array([1, 2, 3, 4, 5])

# making subplots
fig, ax = plt.subplots(2, 2)

# set data with subplots and plot
title = ["Linear","Double","Square","Cube"]
y = [x, x*2, x*x, x*x*x]

for i in range(4):

    # subplots
    plt.subplot(2, 2, i+1)

    # plotting (x,y)
    plt.plot(x, y[i])

    # set the title to subplots
    plt.gca().title.set_text(title[i])

# set spacing
fig.tight_layout()
plt.show()
How to Set a Single Main Title for All the Subplots in Matplotlib?
A title in Matplotlib library describes the main subject of plotting the graphs. Setting a title for just one plot is easy using the title() method. By using this function only the individual title plots can be set but not a single title for all subplots. Hence, to set a single main title for all subplots, suptitle() method is used.
Syntax: suptitle(self, t, **kwargs)
Parameters: This method accept the following parameters that are discussed below:
t : This parameter is the title text.
x: This parameter is the x location of the text in figure coordinates.
y: This parameter is the y location of the text in figure coordinates.
horizontalalignment, ha : This parameter is the horizontal alignment of the text relative to (x, y).
verticalalignment, va : This parameter is the vertical alignment of the text relative to (x, y).
fontsize, size : This parameter is the font size of the text.
fontweight, weight : This parameter is the font weight of the text.
Returns: This method returns the Text instance of the title.
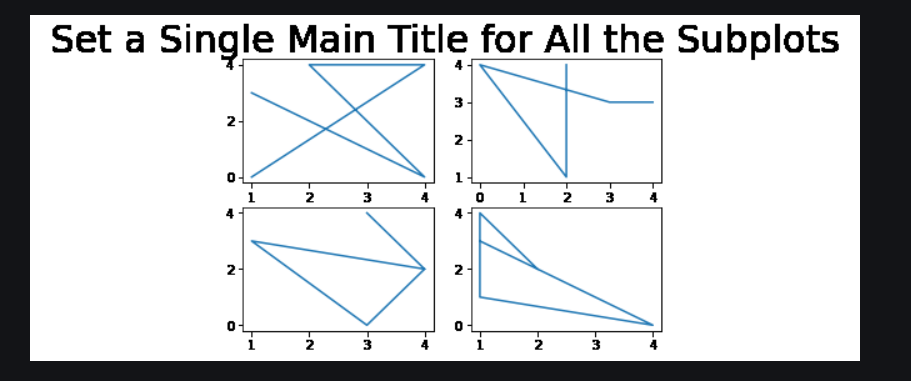
Setting a Single Title for All the Subplots
In this example, we will import the required library and create a 2*2 plot. We are creating random data by using random.randint to plot our graph and then setting a single title for all the subplots.
# importing packages
import matplotlib.pyplot as plt
import numpy as np

# making subplots objects
fig, ax = plt.subplots(2, 2)

# draw graph
ax[0][0].plot(np.random.randint(0, 5, 5), np.random.randint(0, 5, 5))
ax[0][1].plot(np.random.randint(0, 5, 5), np.random.randint(0, 5, 5))
ax[1][0].plot(np.random.randint(0, 5, 5), np.random.randint(0, 5, 5))
ax[1][1].plot(np.random.randint(0, 5, 5), np.random.randint(0, 5, 5))


fig.suptitle(' Set a Single Main Title for All the Subplots ', fontsize=30)
plt.show()
Output:
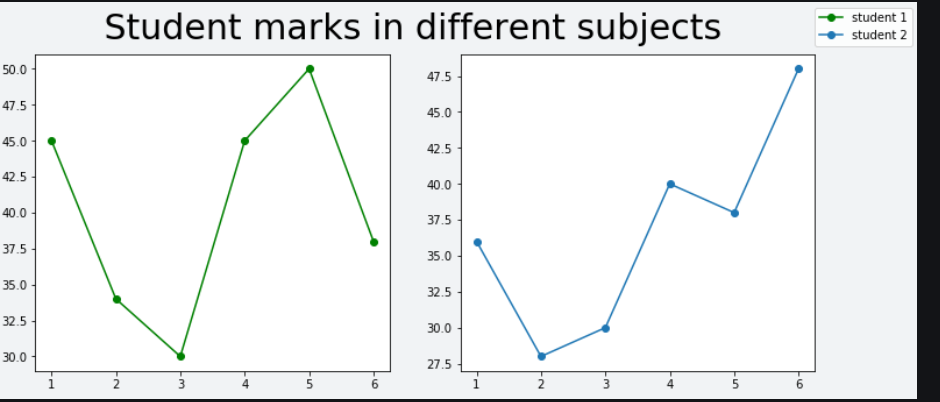
**Here, we are creating data to plot our graph and using a marker**.
import matplotlib.pyplot as plt
import numpy as np
fig, (ax1, ax2) = plt.subplots(1, 2, figsize=(12, 5))
x1 = [1, 2, 3, 4, 5, 6]
y1 = [45, 34, 30, 45, 50, 38]
y2 = [36, 28, 30, 40, 38, 48]
labels = ["student 1", "student 2"]
Add title to subplot
fig.suptitle(' Student marks in different subjects ', fontsize=30)
Creating the sub-plots.
l1 = ax1.plot(x1, y1, 'o-', color='g')
l2 = ax2.plot(x1, y2, 'o-')
fig.legend([l1, l2], labels=labels,
loc="upper right")
plt.subplots_adjust(right=0.9)
plt.show()
Output:
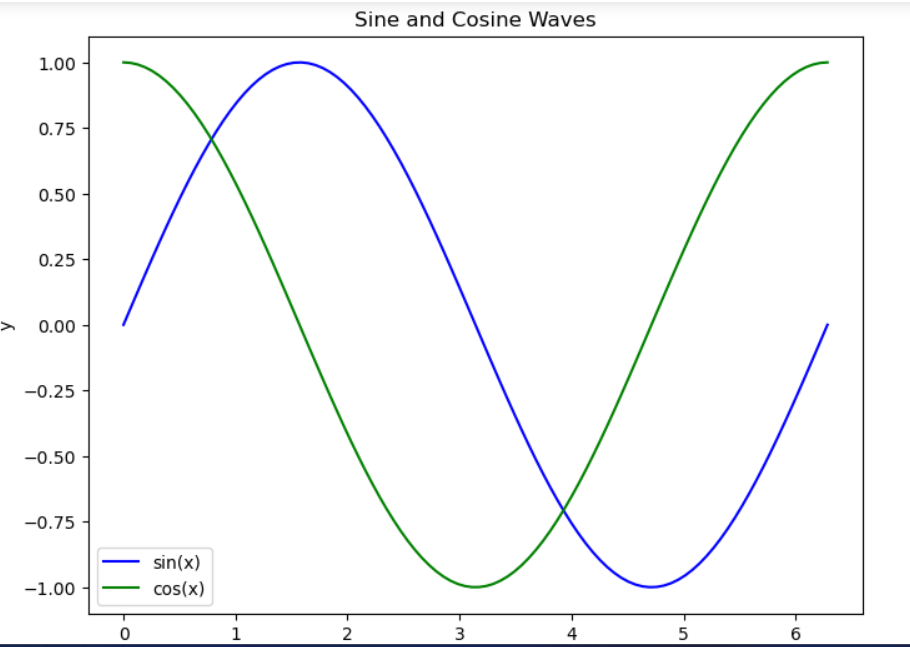
## How to draw multiple plot with oops approach and without oops approach
import matplotlib.pyplot as plt
import numpy as np
Generate some sample data
x = np.linspace(0, 2*np.pi, 100)
y1 = np.sin(x)
y2 = np.cos(x)
Create a new figure
plt.figure(figsize=(8, 6))
Plot the sine wave
plt.plot(x, y1, label='sin(x)', color='blue')
Plot the cosine wave
plt.plot(x, y2, label='cos(x)', color='green')
Add labels and title
plt.xlabel('x')
plt.ylabel('y')
plt.title('Sine and Cosine Waves')
Add a legend
plt.legend()
Show the plot
plt.show()
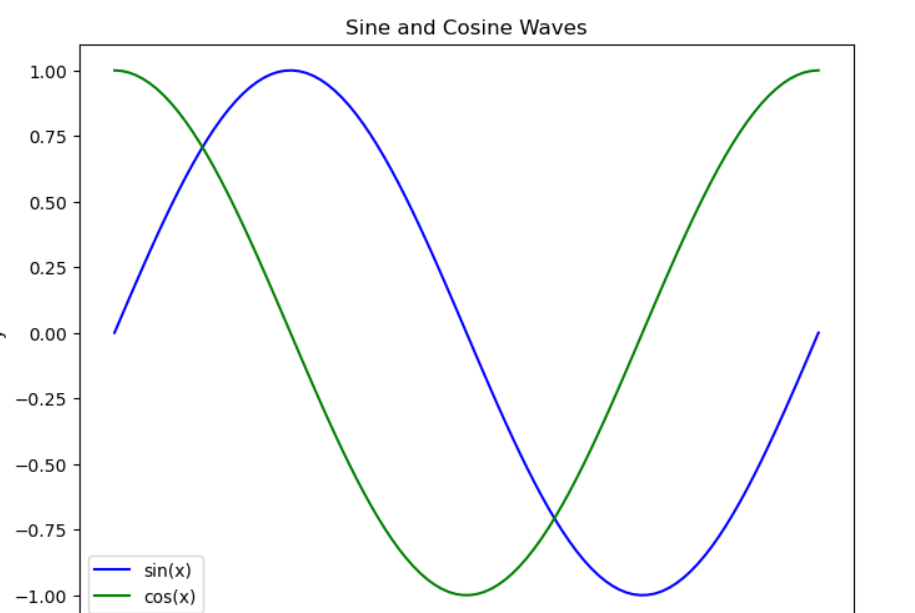
## Using Oops approach
import matplotlib.pyplot as plt
import numpy as np
Generate some sample data
x = np.linspace(0, 2*np.pi, 100)
y1 = np.sin(x)
y2 = np.cos(x)
Create a new figure and axes objects
fig, ax = plt.subplots(figsize=(8, 6))
Plot the sine wave
ax.plot(x, y1, label='sin(x)', color='blue')
Plot the cosine wave
ax.plot(x, y2, label='cos(x)', color='green')
Add labels and title
ax.set_xlabel('x')
ax.set_ylabel('y')
ax.set_title('Sine and Cosine Waves')
Add a legend
ax.legend()
Show the plot
plt.show()

Top comments (0)