amazon cloud watch definition
amazon cloud watch architecture
amazon cloud watch real-time application
amazon cloud watch example
Who is responsible for monitoring and observing resources in real-time
How you can optimize resource utilization
CloudWatch observes what kind of anomalous behavior in the environments
Represents time-ordered set of data points
Who is name/value pair which uniquely identifies a metric
amazon cloud watch definition
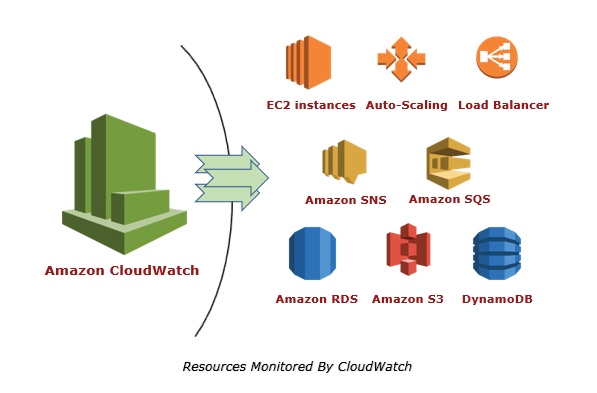
Amazon CloudWatch is a service used for monitoring and observing resources in real-time, built for DevOps engineers, developers, site reliability engineers (SREs), and IT managers. CloudWatch provides users with data and actionable insights to monitor their respective applications, stimulate system-wide performance changes, and optimize resource utilization. CloudWatch collects monitoring and operational data in the form of logs, metrics, and events, providing its users with an aggregated view of AWS resources, applications, and services that run on AWS. The CloudWatch can also be used to detect anomalous behavior in the environments, set warnings and alarms, visualize logs and metrics side by side, take automated actions and troubleshoot issues.
amazon cloud watch architecture
Terminologies related to Amazon Cloudwatch
Metrics
- It represents a time-ordered set of data points that are published to Amazon CloudWatch
- All data point is marked with a timestamp
- Metric is a variable that is monitored and data points are the value of that variable over time
- They are uniquely defined by a name, namespace, and zero or more dimensions
Metric math is used to query multiple cloudwatch metrics and use math expressions to create new time-series based on these metrics
DimensionsA dimension is a name/value pair which uniquely identifies a metric
Dimensions are the unique identifiers for a metric, so whenever you add a unique name/value pair to one of the metrics, you are creating a new variation of that metric
.
StatisticsStatistics are metric data aggregations over specified periods of time
The few available statistics on Cloudwatch are maximum, minimum, sum, average, and sample count.
Alarm
- It is used to automatically initiate actions on our behalf
- It watches a single metric over a specified time period and performs one or more specified actions based on the value of the metric
The estimated AWS charges can also be monitored using the alarm
PercentilesIt represents the relative weightage of the data in a dataset
It helps the user to get a better understanding of the distribution of metric data
Cloudwatch dashboardA user-friendly Cloudwatch console is available which is used for monitoring resources in a single view.
There is no limit on the number of cloudwatch dashboards you can create.
These dashboards are global and not region-specific
Cloudwatch agentIt is required to be installed
It collects logs and system-level metrics from EC2 instances and on-premises servers
Cloudwatch Events:
Cloudwatch events help you to create a set of rules that match with any event(i.e stopping of EC2 instance).
These events can be routed to one or more targets like AWS Lambda functions, Amazon SNS Topics, Amazon SQS queues, and other target types.
Cloudwatch Events observes the operational events continuously and whenever there is any change in the state of the event, it performs the action by sending notifications, activating lambda, etc.
An event indicates a change in the AWS environment. Whenever there is a change in the state of AWS resources, events are generated.
Rules are used for matching events and routing to targets.
Target process events. They include Amazon EC2 instances, AWS Lambda functions, etc. A target receives the events in JSON format.
Cloudwatch logs:
Amazon Cloudwatch logs enable you to store, monitor, and access files from AWS resources like Amazon EC2 instances, Route53, etc.
It also helps you to troubleshoot your system errors and maintain the logs in highly durable storage.
It also creates log of information about the DNS queries that Route 53 receives
amazon cloud watch real-time application
Publishing custom metrics to Amazon CloudWatch using the AWS SDK for Python (Boto3) plays a crucial role in monitoring and analyzing the behavior, performance, and health of your applications or business logic. Here are key aspects of how custom metrics can be beneficial:
Monitoring Application Performance:
Granular Visibility: Custom metrics allow you to define and publish specific data points that are relevant to your application's behavior or performance. This could include things like the number of processed records, user activity, response times, or any other relevant metric.
Fine-Grained Analysis: By publishing custom metrics, you can gain detailed insights into specific aspects of your application's performance. This is particularly valuable when you need more granularity than standard AWS metrics provide.
Detecting Anomalies and Issues:
Threshold Alarms: You can set up CloudWatch Alarms based on your custom metrics to trigger notifications or automated actions when certain thresholds are breached. For example, you might set an alarm to notify you if the number of errors exceeds a specific threshold.
Proactive Monitoring: Custom metrics enable proactive monitoring by allowing you to define specific conditions or patterns that may indicate potential issues before they escalate.
Capacity Planning and Scaling:
Resource Utilization: Monitoring custom metrics helps in understanding the resource utilization of your application components. This information is vital for making informed decisions about scaling your infrastructure up or down based on demand.
Optimizing Resources: By analyzing custom metrics, you can identify underutilized or overutilized resources, leading to optimization opportunities and cost savings.
Business Logic Insights:
Business KPIs: Custom metrics can be used to track business-related key performance indicators (KPIs). For example, the number of orders processed, active users, or revenue generated.
Behavioral Patterns: By monitoring custom metrics, you can gain insights into how users interact with your application and identify patterns or trends that impact user experience.
Custom Reporting and Dashboards:
Custom Dashboards: You can create custom dashboards in CloudWatch that aggregate and visualize your custom metrics alongside standard AWS metrics. This provides a unified view of the health and performance of your entire application stack.
Custom Reports: Custom metrics contribute to more comprehensive reports that can be shared with stakeholders, providing a clear picture of your application's performance over time.
In summary, publishing custom metrics to CloudWatch using Boto3 empowers you to tailor your monitoring strategy to the specific needs of your business logic or application. It allows you to capture, analyze, and act upon data that is most relevant to your operational and business goals, facilitating a more proactive and informed approach to managing your AWS resources.
amazon cloud watch example
! Let's consider an example where you have a serverless application processing orders, and you want to monitor the number of orders processed per minute. You could use custom CloudWatch metrics to gain insights into your application's performance.
import boto3
from datetime import datetime

def process_order(order_data):
    # Business logic for processing orders
    print(f"Processing order: {order_data}")

    # Assume the order processing is successful
    return True

def publish_order_processing_metric(successful_order):
    cloudwatch = boto3.client('cloudwatch')
    metric_name = 'OrdersProcessed'
    namespace = 'MyApplication'

    # Count the number of orders processed (1 for successful, 0 for unsuccessful)
    metric_value = 1 if successful_order else 0

    response = cloudwatch.put_metric_data(
        MetricData=[
            {
                'MetricName': metric_name,
                'Dimensions': [
                    {
                        'Name': 'Environment',
                        'Value': 'Production',
                    },
                ],
                'Timestamp': datetime.utcnow(),
                'Value': metric_value,
                'Unit': 'Count',
            },
        ],
        Namespace=namespace
    )

# Example of processing multiple orders
orders = [
    {'order_id': 1, 'item': 'Product A'},
    {'order_id': 2, 'item': 'Product B'},
    # ... additional orders
]

for order in orders:
    # Simulate order processing, assuming it's successful for simplicity
    successful_order = process_order(order)

    # Publish a CloudWatch metric for each processed order
    publish_order_processing_metric(successful_order)
Explanation:
process_order Function:
Simulates the business logic for processing orders.
For simplicity, it prints a message and returns True to indicate a successful order processing.
publish_order_processing_metric Function:
- Publishes a custom CloudWatch metric named 'OrdersProcessed' to the 'MyApplication' namespace.
- Uses a dimension named 'Environment' with a value of 'Production'.
- Counts the number of orders processed (1 for successful orders, 0 for unsuccessful ones).
- Sets the metric timestamp to the current UTC tim e. Processing Multiple Orders:
Loops through a list of orders.
For each order, calls process_order to simulate order processing.
Calls publish_order_processing_metric to publish a CloudWatch metric based on the success of order processing.
In this example, you're monitoring the number of orders processed per minute as a custom CloudWatch metric. The metric is specific to your business logic and provides insights into the application's performance related to order processing.
Another Example
Amazon CloudWatch is a monitoring and observability service provided by AWS. It allows you to collect and track metrics, collect and monitor log files, and set alarms. Here are some key terminologies related to Amazon CloudWatch along with real-time coding examples:
Metric:
Definition: A metric is a fundamental concept in CloudWatch representing a time-ordered set of data points. Each data point has a timestamp and a value.
import boto3

# Create CloudWatch client
cloudwatch = boto3.client('cloudwatch')

# Put a custom metric data point
cloudwatch.put_metric_data(
    Namespace='MyNamespace',
    MetricData=[
        {
            'MetricName': 'MyMetric',
            'Dimensions': [
                {
                    'Name': 'Environment',
                    'Value': 'Production'
                },
            ],
            'Timestamp': '2023-12-01T00:00:00Z',
            'Value': 42,
            'Unit': 'Count'
        },
    ]
)
Namespace:
Definition: A namespace is a container for CloudWatch metrics. It helps to organize and differentiate metrics from different applications or services.
Example Code:
# Namespace is specified when putting a metric
'Namespace': 'MyNamespace',
Dimension:
Definition: A dimension is a name-value pair that uniquely identifies a metric. It allows you to slice and filter metric data.
Example Code:
# Dimensions are specified when putting a metric
'Dimensions': [
    {
        'Name': 'Environment',
        'Value': 'Production'
    },
],
Alarm:
Definition: An alarm monitors a metric over a specified time period and performs one or more actions based on the value of the metric relative to a threshold over time.
Example Code:
# Create an alarm for a metric
cloudwatch.put_metric_alarm(
    AlarmName='MyAlarm',
    AlarmDescription='Alarm when MyMetric exceeds 50',
    ActionsEnabled=True,
    MetricName='MyMetric',
    Namespace='MyNamespace',
    Statistic='Average',
    Period=300,
    EvaluationPeriods=1,
    Threshold=50,
    ComparisonOperator='GreaterThanOrEqualToThreshold',
    Dimensions=[
        {
            'Name': 'Environment',
            'Value': 'Production'
        },
    ],
)
Dashboard:
Definition: A CloudWatch dashboard is a customizable home page in the CloudWatch console that you can use to monitor your resources in a single view.
Example Code: Dashboards are typically created and managed through the AWS Management Console.
Logs:
Definition: CloudWatch Logs enables you to centralize the logs from your applications, servers, and AWS services.
Example Code: Logging involves configuring your application or service to send logs to CloudWatch Logs. The specific configuration depends on the application or service.
These examples provide a basic understanding of how to interact with CloudWatch using the AWS SDK for Python (Boto3). Keep in mind that the actual implementation and configuration might vary based on your specific use case and requirements.

Top comments (0)