The adjusted R-squared is a statistical measure that assesses the goodness-of-fit of a regression model, taking into account the number of predictors (independent variables) used in the model. It addresses the issue of overfitting by penalizing models with a high number of predictors, ensuring a more accurate representation of the model's predictive power.
how well model fits on dataset
Example: when i give lecture how much u understood,similarly
when i give my training data to model how much model understood on given dataset
The adjusted R-squared is an extension of the R-squared (coefficient of determination) and is defined as:
Adjusted R-squared = 1 - [(1 - R-squared) * (n - 1) / (n - k - 1)]
where R-squared represents the proportion of the variance explained by the model, n is the number of observations, and k is the number of predictors in the model.
The role of adjusted R-squared in machine learning is as follows:
Model Comparison: Adjusted R-squared helps compare different models with varying numbers of predictors. It allows us to evaluate whether additional predictors in a more complex model contribute significantly to the predictive power or merely introduce noise. A higher adjusted R-squared indicates a better-fitting model with a more appropriate balance between the number of predictors and the model's explanatory power.
higher adjusted R-squared score indicates that
 a larger proportion of the variance in
 the dependent variable
A lower adjusted R-squared score suggests that a smaller proportion of the variance in the dependent variable
may not be capturing the underlying relationships well
Overfitting Control: Adjusted R-squared penalizes the addition of unnecessary predictors that may lead to overfitting. Overfitting occurs when a model performs exceptionally well on the training data but fails to generalize to unseen data. By adjusting for the number of predictors, the adjusted R-squared helps avoid overfitting by accounting for the potential increase in explained variance due to chance.
Model Parsimony: Adjusted R-squared encourages model simplicity and parsimony. It provides a measure of how well the model performs while considering the complexity introduced by the number of predictors. A higher adjusted R-squared suggests that the model achieves a better fit without relying on an excessive number of predictors, promoting simplicity and interpretability.
Variable Selection: Adjusted R-squared can assist in variable selection by guiding the inclusion or exclusion of predictors in the model. It helps identify the subset of predictors that contribute significantly to the model's performance while avoiding the inclusion of irrelevant or redundant predictors.
Example:
Suppose we have a dataset with a dependent variable (y) and five potential predictors (x1, x2, x3, x4, x5). We fit different regression models using varying combinations of these predictors. The table below shows the R-squared and adjusted R-squared values for three different models:
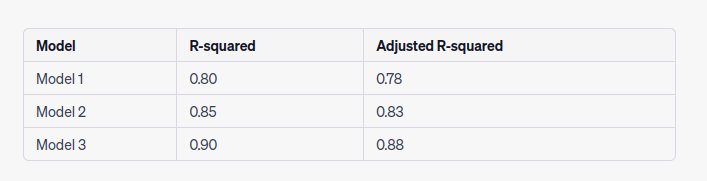
In this example, all three models have good R-squared values, indicating reasonable levels of explained variance. However, when considering the number of predictors, the adjusted R-squared values reveal additional insights. Model 3, despite having the highest R-squared, has a slightly lower adjusted R-squared compared to Model 2. This suggests that the additional predictor(s) in Model 3 do not contribute significantly to the model's performance and may be introducing noise. Hence, Model 2 might be a more appropriate choice, striking a balance between the number of predictors and model performance.
By using the adjusted R-squared, we can make informed decisions about model selection, predictor inclusion, and control overfitting, promoting more robust and reliable machine learning models.
Question
R adjusted score measures
R adjusted score determine how model fits on=======
R adjusted score determine control of---------
higher r adjusted score leads-------
lower r adjuted score leads to==========

Top comments (0)