why we need standardization
how to know standardization needed while trained the model
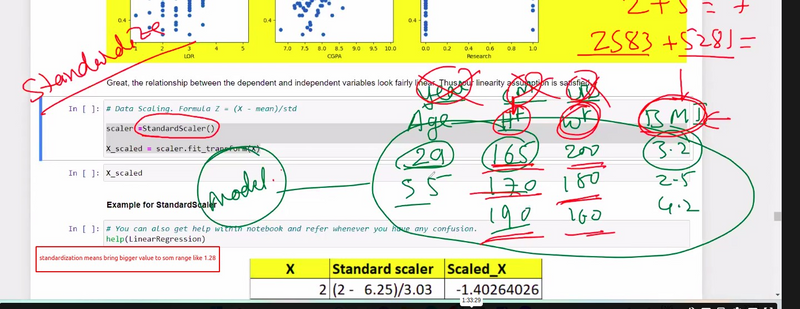
Different way to standardize the data
why we need standardization
Standardization is not always necessary when training a linear regression model, but it can be beneficial in certain situations. Whether or not you should standardize your features in linear regression depends on the characteristics of your dataset and the goals of your analysis. Here's when standardization might be needed or helpful in the context of linear regression, along with examples:
why we r using standard deviation
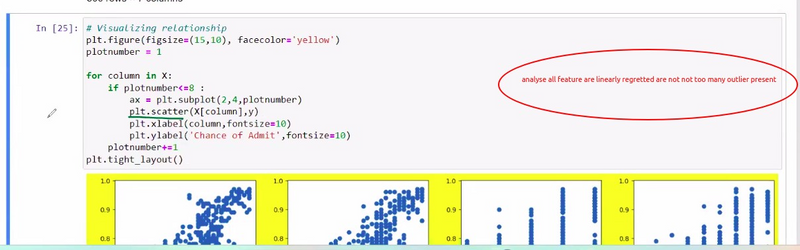
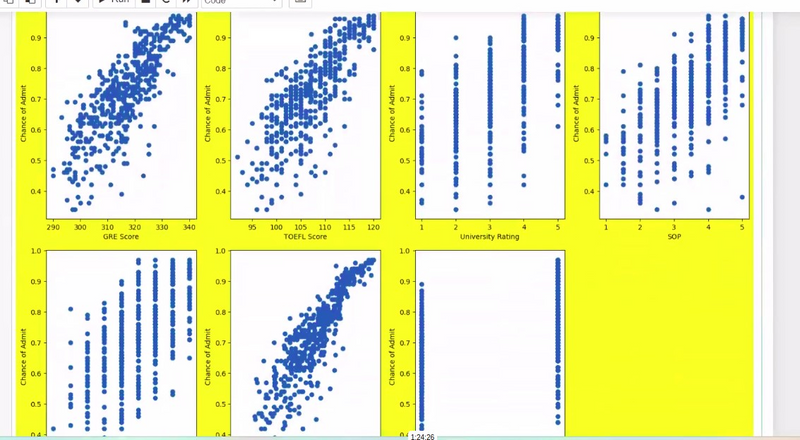
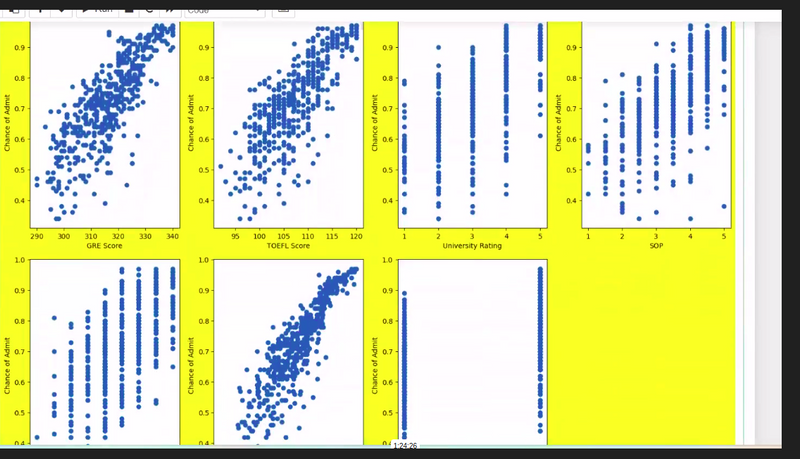
how data is variate from mean or spread out so many visualization technique use like lmplot
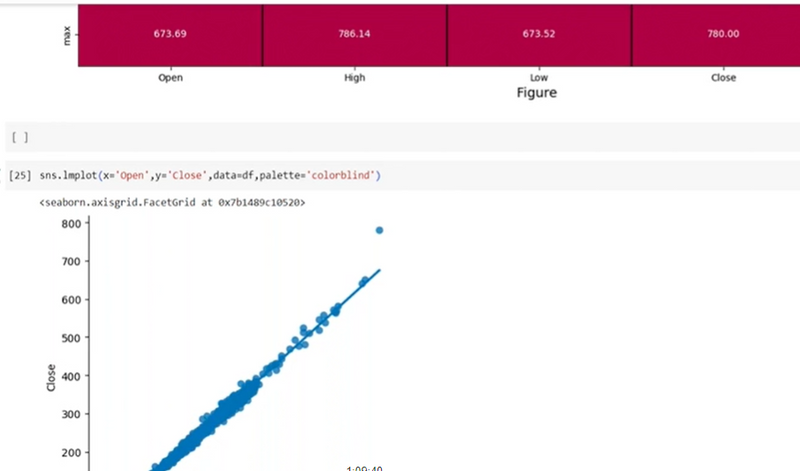
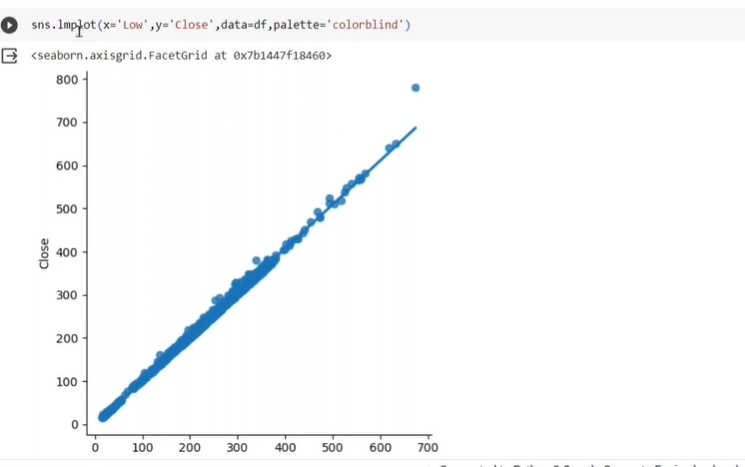
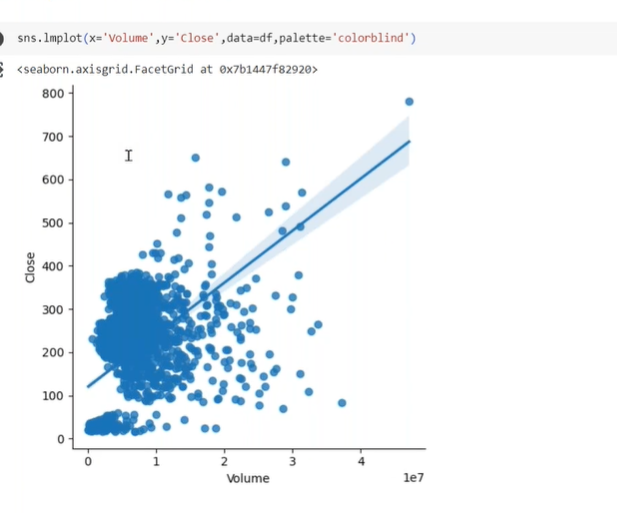
why we use lm.plot
to combine plot and choose best fit line
check strong coreelation and findout data is scattered or collected  to fit in best fit line
Features with Different Scales:
When your input features have significantly different scales, standardization can be useful. It ensures that the coefficients of the features are on a similar scale, making it easier to compare their contributions to the target variable.
Example: In a linear regression model predicting a person's income based on their years of education and age, the years of education might be in the range of 12-20, while age could range from 20-70. Standardizing both features will help in comparing their impact on income more meaningfully.
Interpretability:
Standardization enhances the interpretability of regression coefficients. By standardizing your features, the coefficients represent the change in the target variable (response variable) in standard deviations for a one-standard-deviation change in the predictor variable. This allows for better comparison of the feature impacts.
Example: In a linear regression model predicting house prices based on square footage and the number of bedrooms, standardizing both features will make the coefficients indicate how many standard deviations the price changes for a one-standard-deviation increase in square footage or the number of bedrooms.
Regularization:
If you plan to apply regularization techniques like L1 (Lasso) or L2 (Ridge) regularization to control model complexity, standardization is essential. Regularization penalties are applied to the coefficients, and their effect depends on the scale of the coefficients. Standardization ensures that all coefficients are treated equally in the regularization process.
Example: When using Ridge regression to predict stock prices with features like price-earnings ratio and market capitalization, standardization is crucial for consistent and effective regularization.
Gradient Descent:
In cases where gradient descent is used for optimization, having standardized features can improve the convergence rate and overall training performance. Gradient descent can be more stable with standardized data.
Example: In a linear regression model to predict the time it takes to assemble a product based on the number of components and the number of workers, standardizing these features can help gradient descent algorithms converge more efficiently.
However, there are situations where standardization might not be necessary, such as when features are already on a similar scale, or when you are more interested in the model's predictive power rather than feature interpretability.
how to know standardization needed while trained the model
Determining whether your dataset requires standardization in machine learning is an important step in the data preprocessing phase. Standardization, also known as feature scaling, is typically needed when the features in your dataset have different scales, and it's crucial to maintain the same order of magnitude for all features. Here's how to assess whether your dataset needs standardization, along with examples:
Visual Inspection:
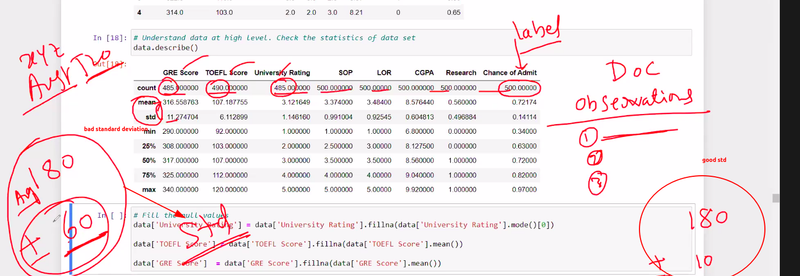
Start by visually inspecting your dataset using descriptive statistics and plots. Look for variations in the scale of features. Box plots, histograms, and summary statistics can help you identify potential discrepancies in feature scales.
Example: If you're working with a dataset that includes features like "income" (in thousands of dollars) and "age" (in years), comparing the range and distribution of these two features can reveal differences in scale.
Statistical Measures:
Calculate summary statistics, such as the mean, standard deviation, and range for each feature. This can give you an idea of how much each feature varies and whether the scales are significantly different.
Example: Suppose you have a dataset with features like "height" (in centimeters) and "weight" (in kilograms). Calculating the mean and standard deviation for each feature can help you assess their scales.
Model Sensitivity:
Consider the machine learning algorithms you plan to use. Some algorithms, like K-Nearest Neighbors and Support Vector Machines, are sensitive to feature scaling and may perform poorly with unscaled data. If you're unsure, it's a good practice to standardize your features to be safe.
Example: If you're building a K-Nearest Neighbors classifier to predict customer satisfaction based on "age" and "purchase amount," it's important to standardize these features to ensure the algorithm works effectively.
Impact on Model Interpretation:
Think about the interpretability of the model. If you want to interpret the coefficients or feature importance, standardization is often helpful, as it makes the contributions of features more directly comparable.
Example: In a linear regression model to predict home prices using features like "square footage" (in square feet) and "number of bedrooms," standardizing these features allows you to compare the coefficients in terms of their impact on the price per standard deviation.
Data Distribution:
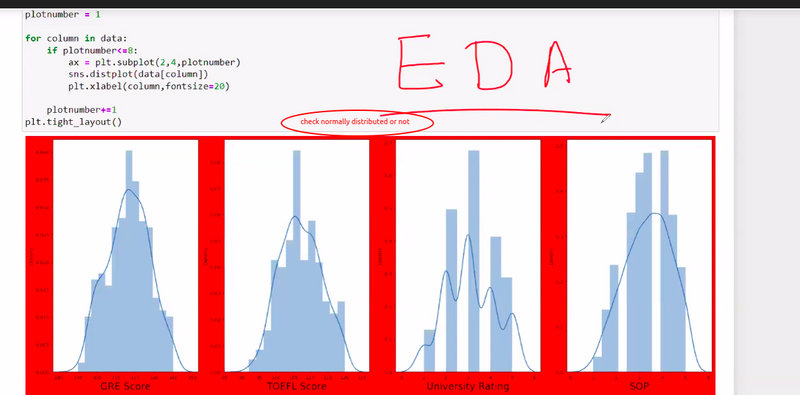
Examine the distribution of your features. If the features follow a Gaussian (normal) distribution, they might not require standardization. However, if the data has a skewed or non-normal distribution, standardization can be beneficial.
Example: In a dataset of exam scores, if the scores are already normally distributed, you may not need to standardize the features. But if the scores are skewed, standardization can make the modeling process more robust.
Feature Engineering:
Consider whether you've engineered new features or transformed existing features. Standardization may be necessary for the new features you've created to maintain consistent scales.
Example: You've created a feature "income per capita" by dividing "income" by "population." Since the scale of this new feature differs from the original features, it should be standardized.
Model Evaluation:
Try training your machine learning model with and without standardization. Evaluate the model's performance using metrics like accuracy, RMSE (Root Mean Square Error), or any relevant evaluation metric. Standardization may improve or degrade model performance, depending on the dataset and the algorithm used.
Example: Train a regression model to predict sales revenue from advertising spending without standardizing the features, and then compare the results to the same model with standardized features.
Standard deviation and quartiles are statistical measures commonly used in machine learning to analyze and understand the distribution of data. They provide valuable insights into the spread and central tendency of a dataset, allowing for better understanding and decision-making in various machine learning tasks.
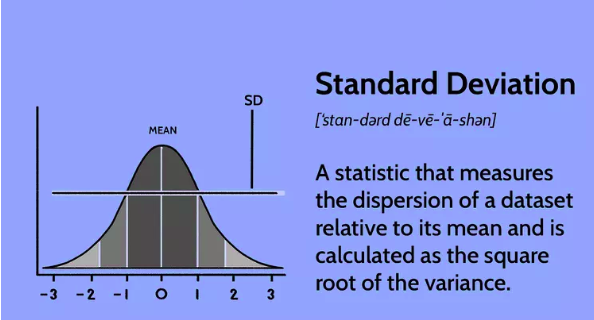
Standard Deviation:
The standard deviation measures the average amount of variation or dispersion of a dataset. It quantifies how far individual data points deviate from the mean (average) value. A higher standard deviation indicates a wider spread of data points, while a lower standard deviation suggests that the data points are closer to the mean.
Standard deviation is calculated using the following steps:
Calculate the mean (average) of the dataset.
Subtract the mean from each data point and square the result.
Calculate the average of the squared differences.
Take the square root of the average to obtain the standard deviation.
Standard deviation is useful in machine learning in several ways:
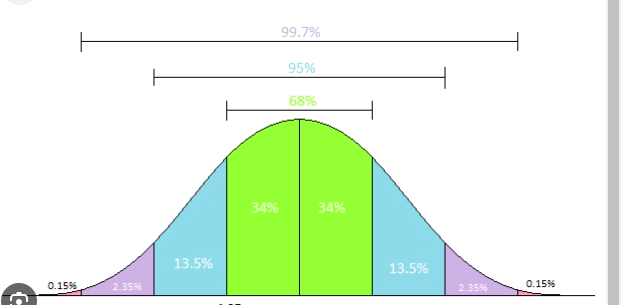
Data Distribution: Standard deviation provides insights into the distribution of data. It helps identify data points that are significantly different from the mean and identifies the degree of variability in the dataset.
Outlier Detection: Standard deviation can be used to detect outliers—data points that deviate significantly from the mean. Outliers can be indicative of errors, anomalies, or important data points requiring further investigation.
Feature Selection: Standard deviation can be used as a criterion for feature selection. Features with low standard deviation may contain little information and contribute less to the predictive power of the model, thus guiding the selection of relevant features.
Model Evaluation: Standard deviation is often used as a metric to evaluate the performance of machine learning models. It can be used to assess the variability or dispersion of the model's predictions, providing insights into the model's accuracy and stability.
Quartiles:
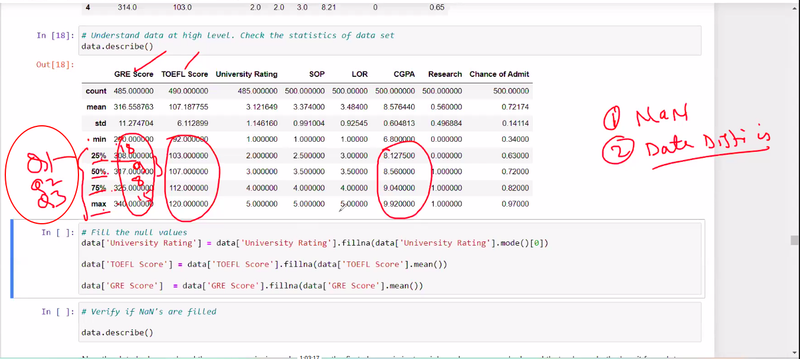
Quartiles divide a dataset into four equal parts, each containing an equal number of data points. These quartiles provide information about the distribution and spread of data, particularly in terms of percentiles.
The three quartiles are:
First Quartile (Q1): Also known as the lower quartile, it represents the 25th percentile of the data. It marks the point below which 25% of the data falls.
Second Quartile (Q2): Also known as the median, it represents the 50th percentile of the data. It marks the point below which 50% of the data falls.
Third Quartile (Q3): Also known as the upper quartile, it represents the 75th percentile of the data. It marks the point below which 75% of the data falls.
Quartiles are useful in machine learning in various ways:
Data Summarization: Quartiles provide a concise summary of the distribution of data. They offer insights into the spread, skewness, and central tendency of the dataset, allowing for a better understanding of the data's characteristics.
Box Plots: Quartiles are often used to create box plots, which visually represent the distribution of data and identify outliers and the range of values within the dataset.
Outlier Detection: Quartiles are useful in detecting outliers. Data points that fall below the first quartile or above the third quartile are considered potential outliers and may require further investigation or treatment.
Data Partitioning: Quartiles help divide a dataset into quartile groups, enabling the analysis of different subsets of data. For instance, dividing data based on quartiles can be helpful in studying the characteristics and behavior of different segments within a dataset.
By utilizing standard deviation and quartiles, machine learning practitioners can gain insights into the spread, distribution, and variability of data. These statistical measures contribute to better data understanding, model selection, feature engineering, and decision-making processes.

Top comments (0)