Reference1
Reference2
Reference3
Reference4
Reference5
Reference6
Reference7
Dart DevTools from scratch in Flutter
DevTools is a tooling suite for Flutter and Dart developers consisting of layout inspection tools, performance tools, memory tools & many other debugging tools that you need to be an efficient and effective Flutter developer, all bundled into a single web suite for you!
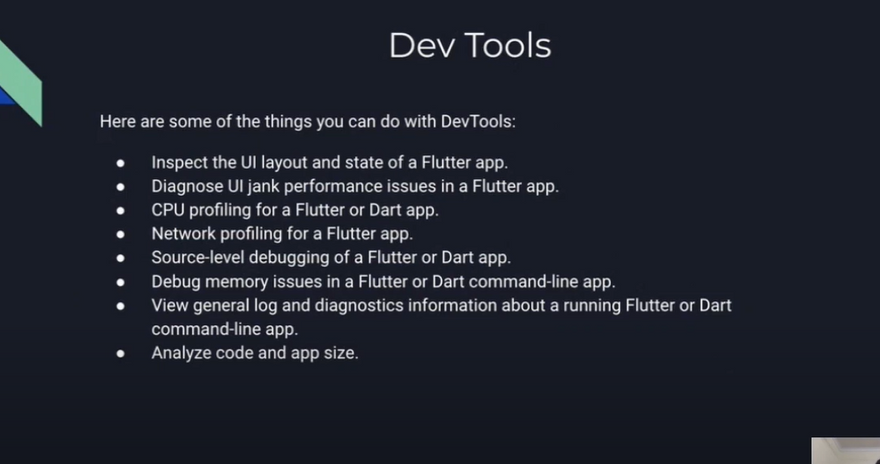
Here are some of things you can do with DevTools —
✅ Inspect the UI layout and state of a Flutter app.
✅ Diagnose UI jank performance issues in a Flutter app.
✅ CPU profiling for a Flutter or Dart app.
✅ Network profiling for a Flutter app.
✅ Source-level debugging of a Flutter or Dart app.
✅ Debug memory issues in a Flutter or Dart command-line app.
✅ View general log and diagnostics information
Overview of features
How to launch DevTools in your favorite editor ?
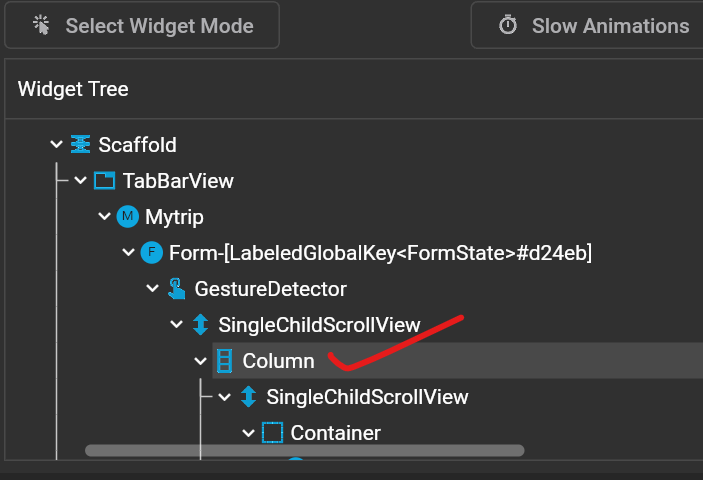
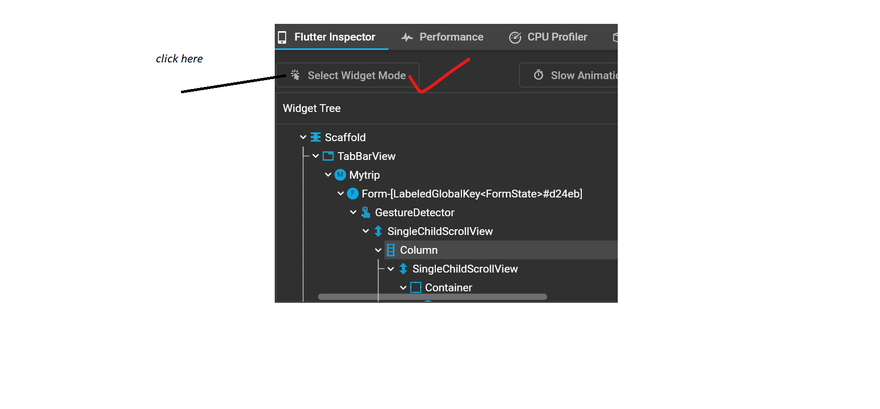
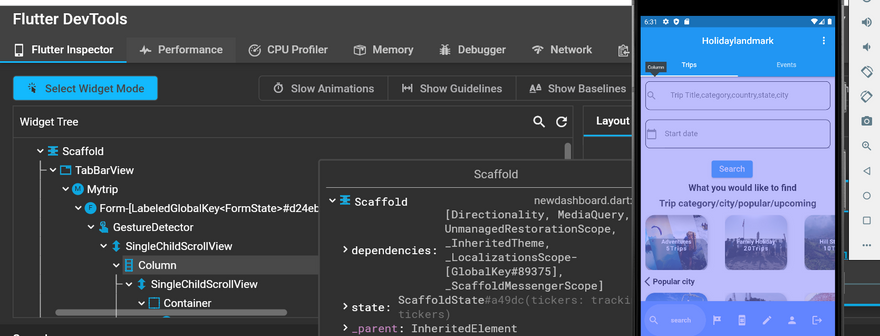
Flutter Inspector
Layout Inspector
Timeline View
Memory View
Performance View
Network View
Debugger
Summary
How to launch DevTools?
You can launch DevTools in VS Code, Android Studio, or even from Command Prompt.
VS Code
Step 1: Activate Debug session for your App
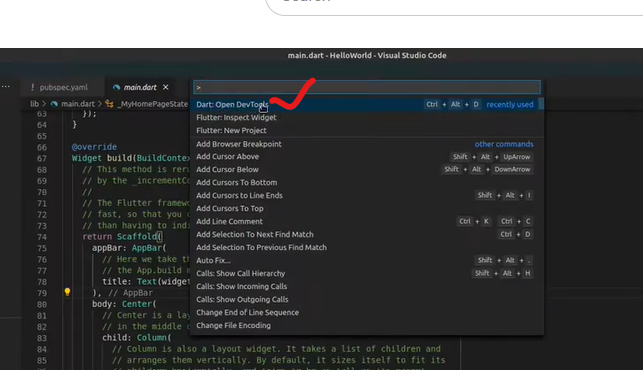
Step 2: Once the debug session is active and the application has started, the Dart: Open DevTools command becomes available in the VS Code command palette:
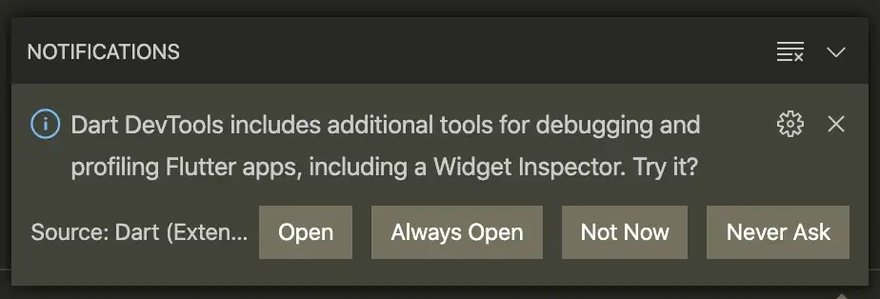
Step 3: The first time you run this (and subsequently when the DevTools package is updated), you are prompted to activate or upgrade DevTools.
Step 4: Click on open & it will launch the DevTools
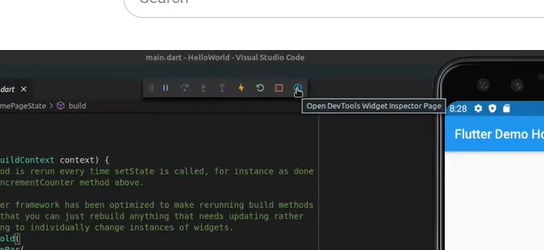
✔Select the Open DevTools toolbar action in the Run view.
✔Select the Open DevTools toolbar action in the Debug view. (if debugging)
✔Select the Open DevTools action from the More Actions menu in the Flutter Inspector view.
there are two ways to open dev tools
Another way:
Step 1:ctrl+shift+p
Step2:
Step3:then Press enter






Top comments (0)