Explain Roc Curve Concept
How to draw Roc curve for multiple model
Calculating ROC curves (Receiver Operating Characteristic) and AUC (Area Under the Curve) scores for multiple models using a for loop is a common practice in machine learning. Here's how you can achieve this using Python and scikit-learn library:
Assuming you have a list of models, and you want to calculate ROC curves and AUC scores for each of them, follow these steps:
CONFUSION MATRIX EXAMPLES
CONFUSION MATRIX==many corona +ve and -ve cases come to doctor , now doctor predidicted some positive and some -ve based on symptoms in confusion matrix row side prediction but in lab
give actual result by test blood test and other test
FP==TYPE1 ERROR
FN==TYPE2 ERROR
type2 is more dangerous because u r thinking ur corona negative because of prection/sympotoms/doctor prediction so u roaming/traveling but in lab test u found positive
symptoms==prediction
lab test result/classification model=== actual result
doctor is model
recall== how many positive patient out of total positive
precision== how many positive parient out of total predicted positive
FN== ultimately sign of Tp
F1 SCORE==take some part of recall and take some part of precision mixed of recall and precision
true positive rate is an example of recall
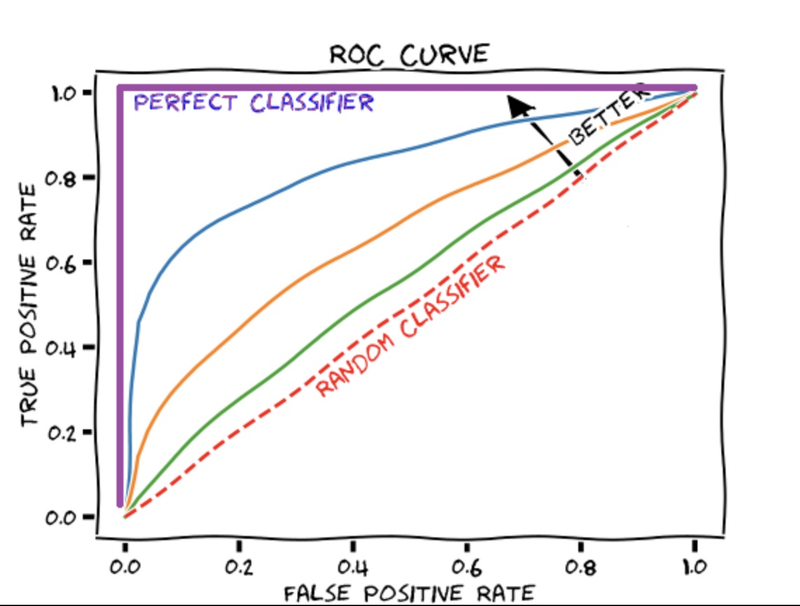
ROC== represents various confusuin matrix for various threshold
if ur threshold value changes then ur confusion matrix,accuracy,recall,precison everything changes
ROC== represent multiple models they predict TPR and FPR
Import necessary libraries:
from sklearn.metrics import roc_curve, auc
from sklearn.model_selection import train_test_split
import matplotlib.pyplot as plt
Define your models and other necessary data:
models = [model1, model2, model3]  # Replace with your models
X_train, X_test, y_train, y_test = train_test_split(X, y, test_size=0.2, random_state=42)
# Replace with your data
Loop through the models, calculate ROC curves and AUC scores, and plot them:
plt.figure(figsize=(10, 8))

for model in models:
    model.fit(X_train, y_train)
    y_scores = model.predict_proba(X_test)[:, 1]  # Assuming you have binary classification

    fpr, tpr, _ = roc_curve(y_test, y_scores)
    roc_auc = auc(fpr, tpr)

    plt.plot(fpr, tpr, label=f'{model.__class__.__name__} (AUC = {roc_auc:.2f})')

plt.plot([0, 1], [0, 1], color='gray', linestyle='--')
plt.xlim([0.0, 1.0])
plt.ylim([0.0, 1.05])
plt.xlabel('False Positive Rate')
plt.ylabel('True Positive Rate')
plt.title('ROC Curve')
plt.legend(loc="lower right")
plt.show()
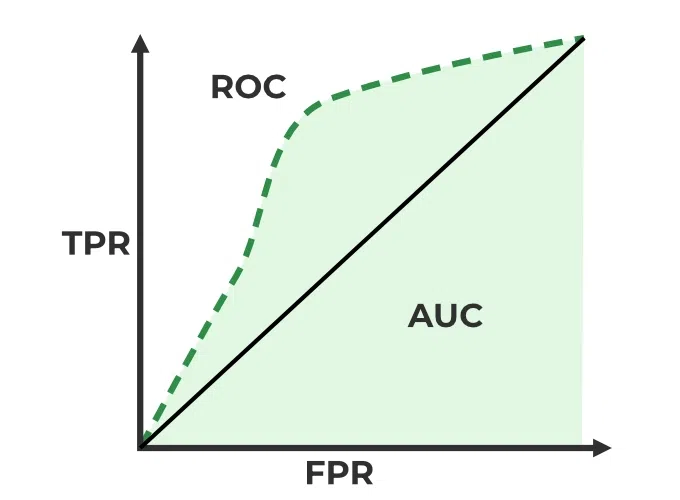
In this code snippet, you iterate through each model, fit it to the training data, calculate predicted probabilities (assumed for binary classification), and then compute the ROC curve and AUC score using roc_curve and auc functions from scikit-learn. The AUC score represents the area under the ROC curve and indicates the model's discriminatory power.
The plt functions are used for plotting the ROC curves. Make sure to replace model1, model2, and model3 with your actual model instances, and X and y with your data.
Remember that ROC curves and AUC scores are typically used for binary classification problems. If you have multi-class classification, you might need to adapt this approach accordingly.
To calculate True Positive Rate (TPR) and False Positive Rate (FPR) for multiple models using a for loop, you can modify the code provided in the previous response. Here's how you can do it:
Assuming you have a list of models and you want to calculate TPR and FPR for each model, follow these steps:
Import necessary libraries:
from sklearn.metrics import confusion_matrix
import numpy as np
Define your models and other necessary data:
models = [model1, model2, model3]  # Replace with your models
X_test = ...  # Replace with your test data
y_test = ...  # Replace with your test labels
Loop through the models, calculate TPR and FPR:
for model in models:
    y_pred = model.predict(X_test)
    cm = confusion_matrix(y_test, y_pred)
    tn, fp, fn, tp = cm.ravel()

    tpr = tp / (tp + fn)
    fpr = fp / (fp + tn)

    print(f"{model.__class__.__name__}:")
    print("True Positive Rate (TPR):", tpr)
    print("False Positive Rate (FPR):", fpr)
    print()
In this code snippet, you loop through each model, predict the labels using the model on the test data, and then calculate the confusion matrix using confusion_matrix from scikit-learn. From the confusion matrix, you extract the values of true negatives (tn), false positives (fp), false negatives (fn), and true positives (tp).
Then, you calculate the TPR (also known as sensitivity or recall) and FPR using the formulas:
TPR = TP / (TP + FN)
FPR = FP / (FP + TN)
You print the TPR and FPR for each model within the loop.
Please replace model1, model2, and model3 with your actual model instances, and X_test and y_test with your test data and labels. Also, make sure that the models are trained and ready for prediction before entering the loop.
How to draw Roc curve for multiple model
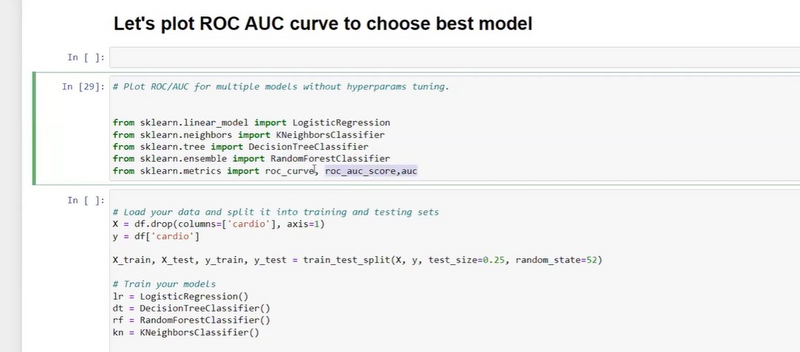
# Import libraries
from sklearn.metrics import roc_curve, auc
from sklearn.linear_model import LogisticRegression
from sklearn.ensemble import RandomForestClassifier
from sklearn.neighbors import KNeighborsClassifier
from sklearn.tree import DecisionTreeClassifier
import matplotlib.pyplot as plt
# Placeholder for data loading and splitting
def load_data():
# Your actual implementation to load and split data
# Replace the following lines with your code
from sklearn.model_selection import train_test_split
X, y = your_actual_data_loading_logic()
return train_test_split(X, y, test_size=0.2, random_state=42)
# Load data
X_train, X_test, y_train, y_test = load_data()
# Create models dictionary
models = {
'Logistic Regression': LogisticRegression(),
'Random Forest': RandomForestClassifier(),
'KNN': KNeighborsClassifier(),
'Decision Tree': DecisionTreeClassifier()
}
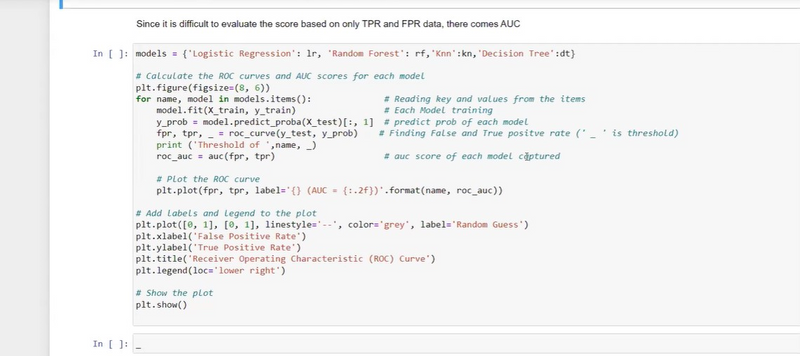
# Calculate ROC curves and AUC scores for each model
plt.figure(figsize=(8, 6))
for name, model in models.items():
# Fit the model
model.fit(X_train, y_train)
# Get predicted probabilities for positive class
y_prob = model.predict_proba(X_test)[:, 1]
# Compute ROC curve and AUC score
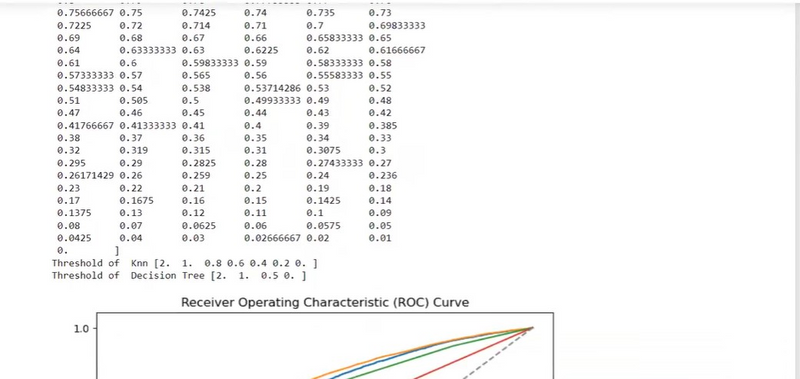
fpr, tpr, thresholds = roc_curve(y_test, y_prob)
roc_auc = auc(fpr, tpr)
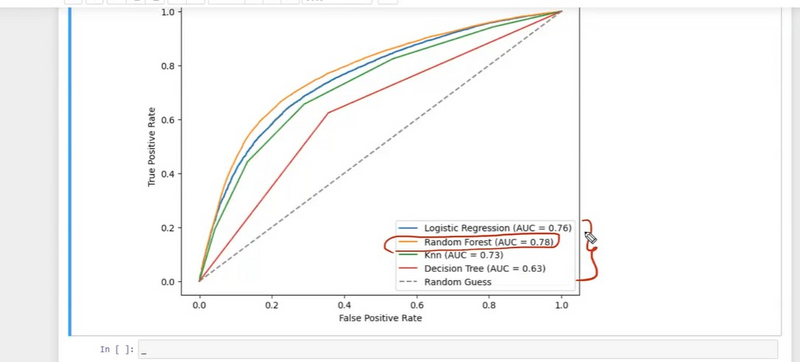
# Print AUC score for each model
print(f'AUC of {name}: {roc_auc:.2f}')
# Plot ROC curve for each model
plt.plot(fpr, tpr, label=f'{name} (AUC: {roc_auc:.2f})')
# Add labels and legend
plt.plot([0, 1], [0, 1], linestyle='--', color='grey', label='Random Guess')
plt.xlabel('False Positive Rate')
plt.ylabel('True Positive Rate')
plt.title('Receiver Operating Characteristic (ROC) Curve')
plt.legend(loc='lower right')
# Show the plot
plt.show()
QUESTION
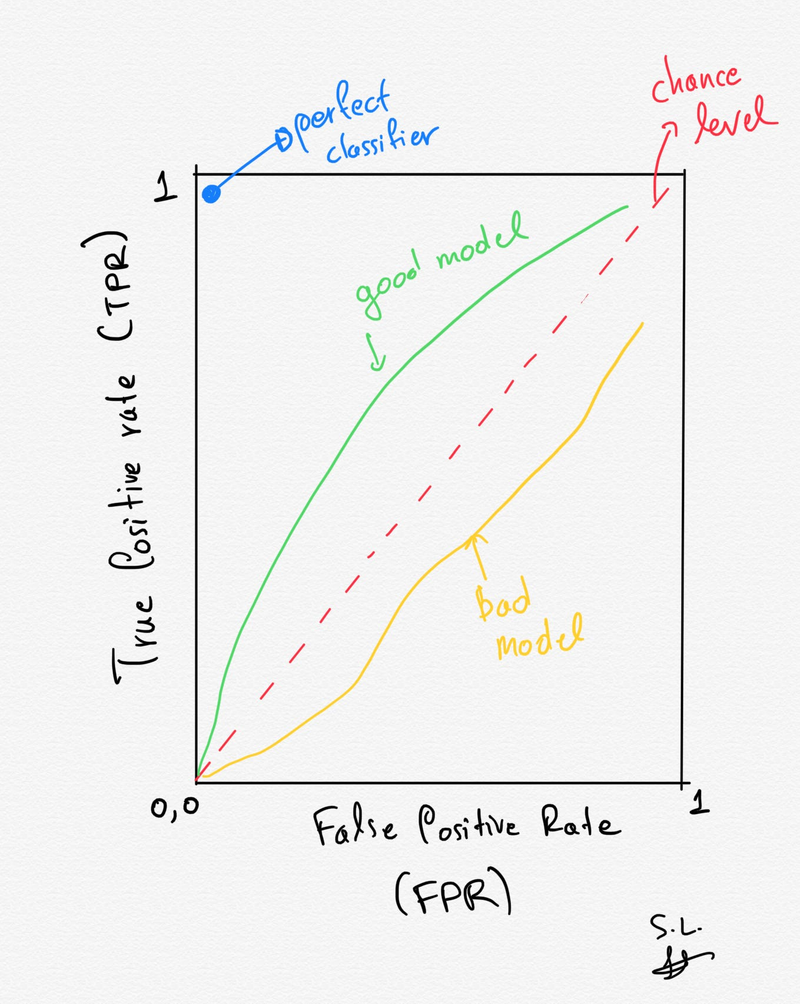
how to predict good model and bad model using ROC curve
how to predict AUC in diagram*
define roc curve represents
which curve give relationship between TPR and FPR on multiple models
What is impact of threshold value changes

Top comments (0)