Check Overall Disk Space Usage on filesystem
Check Space Usage of Specific Directories
Search for Large Files using Find
disk usage for each individual file and subdirectory
Check for MySQL Connection Issues
Examine for Resource Overuse or Crashes
Review Query Errors or Slow Queries
Check for Log Rotation Settings
Address Suspicious Activity
Immediate Actions by clear log file
Third-party tools(Nagios,New Relic,Datadog,DB2 Query Analyzer,Prometheus)
Log analysis tools(Logstash,Splunk,ELK Stack)
Command-line tools
Check Overall Disk Space Usage on filesystem
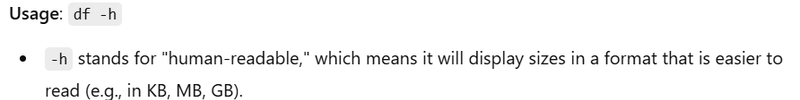
check how much space is used and available on your system's filesystems
df -h
output
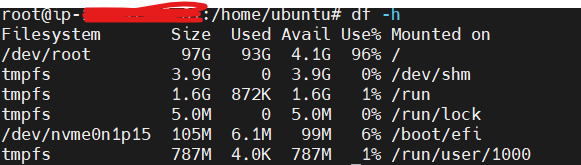
Filesystem      Size  Used Avail Use% Mounted on
/dev/sda1       50G   20G   30G  40% /
/dev/sdb1       100G  40G   60G  40% /home
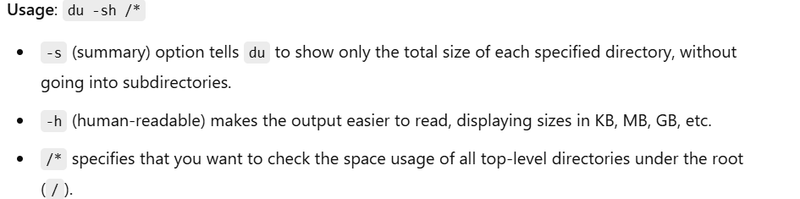
Check Space Usage of Specific Directories
To determine which directories are using up the most space
du -sh /*
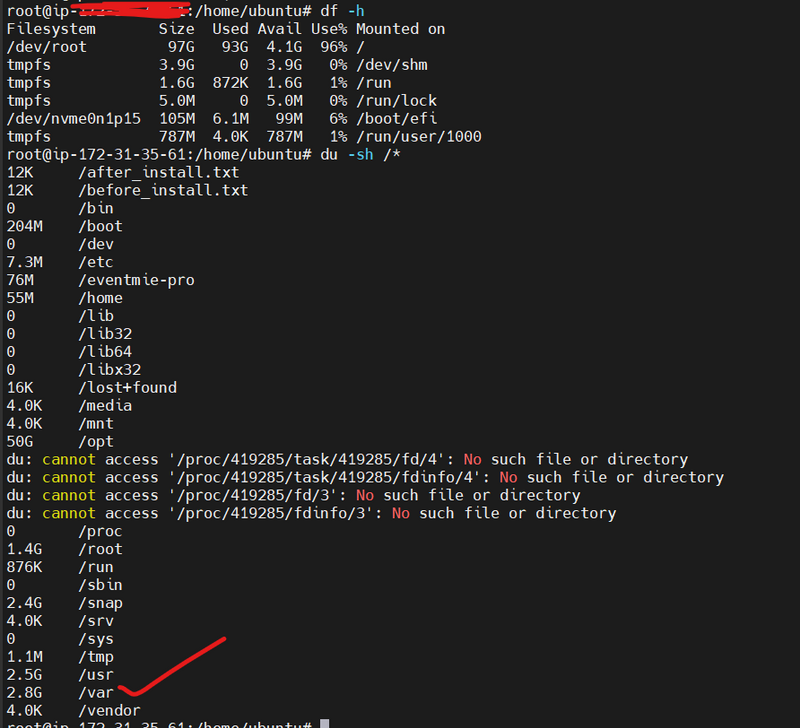
4.0K    /bin
16G     /home
2.1G    /var
8.0K    /tmp
du -sh /var/*
du -sh /home/*
du -sh /tmp/*
du -sh /var/log/*
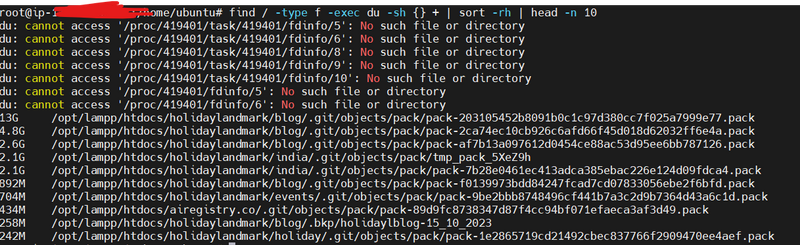
Search for Large Files:
You can also search for the largest files on the system with the find command:
find / -type f -exec du -sh {} + | sort -rh | head -n 10
disk usage for each individual file and subdirectory.
from this command(du -sh /*) we get to know var directory taking more space or by du -ah . | sort -rh | head -n 10
then go to var directory
go to lampp directory
du -ah . | sort -rh | head -n 10
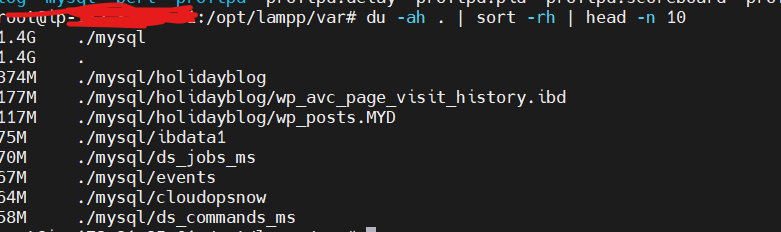
du -sh mysql
how to investigate and understand the reason for this sudden growth
Check for Repeated Errors or Warnings in the Log
The most common reason an error log grows quickly is if there are repeated error messages. You should examine the contents of the error log to find out if any specific errors or warnings are occurring frequently.
You can use cat, less, or more to view the contents:
less /opt/lampp/var/mysql/mysql.err
Or to search for specific patterns (e.g., errors, warnings):
grep -i "error" /opt/lampp/var/mysql/mysql.err
This will show you only the lines that contain the word "error", and you can see if there are repeated errors that might explain the file size increase.
- Check for MySQL Connection Issues MySQL error logs often grow quickly if there are failed connection attempts or authentication issues. This could be due to incorrect configuration or unauthorized access attempts.
Look for entries that mention "Access Denied" or "Connection failed" in the log.
Examine for Resource Overuse or Crashes
Errors related to resource overuse, such as running out of memory or file descriptors, can also fill up the error log. You should check for any logs indicating that MySQL is crashing or being restarted frequently.Review Query Errors or Slow Queries
If there is a particular query that's repeatedly failing, it could generate a large number of logs. Additionally, if you have slow queries enabled, the logs could grow rapidly if your database is under heavy load. You might want to check if any slow queries are being logged.Check for Log Rotation Settings
If log rotation is not configured, error logs can accumulate indefinitely. This is particularly problematic if MySQL is logging verbose or repetitive information.
You can configure MySQL log rotation by setting up tools like logrotate to automatically manage log files and prevent them from growing too large.
- Check for Excessive Logging Configuration Sometimes MySQL logging is set to a very verbose level, capturing every action. You can review the MySQL configuration file (my.cnf or my.ini) to see if the log_error setting or other related parameters are set in a way that could cause excessive logging.
Check for parameters like:
log_error
log_warnings
general_log
slow_query_log
- Address Suspicious Activity If you notice that the logs are related to a specific IP address or a set of IP addresses, it's worth investigating whether these IPs are attempting to breach your system (e.g., through brute-force login attempts or other types of attacks). If this is the case, block those IPs using a firewall.
Immediate Actions:
Clear the Log File: If the file size is a concern and you've reviewed the logs, you can clear it to free up space:
> /opt/lampp/var/mysql/mysql.err
Check for MySQL Connection Issues
Check MySQL Error Log
The MySQL error log often contains useful information about connection issues. You can use grep to filter connection-related errors or warnings from the log:
grep -i "connection" /opt/lampp/var/mysql/mysql.err
This will search for any lines containing the word "connection", which will help you spot any failed or refused connection attempts.
- Check MySQL Logs for Authentication Failures MySQL logs authentication failures when someone tries to connect with incorrect credentials. To filter out authentication-related errors:
grep -i "access denied" /opt/lampp/var/mysql/mysql.err
This will show you any failed login attempts, which might indicate connection issues related to incorrect passwords or user restrictions.
- Check MySQL Status You can use the mysqladmin command to check the current status of MySQL, which includes information on the number of active connections, uptime, and more.
mysqladmin -u root -p status
This command will prompt you for the MySQL root password and display important server status information. Look for any signs of connection problems, like a very high number of active connections or slow responses.
- Check MySQL Configuration for Connection Limits Check the MySQL configuration for connection limits. The configuration file (my.cnf or my.ini) may have certain limits that affect connections. These parameters are important:
max_connections: This defines the maximum number of simultaneous client connections.
wait_timeout: This defines the number of seconds the server waits for activity before closing the connection.
You can check these values by logging into MySQL and running:
SHOW VARIABLES LIKE 'max_connections';
SHOW VARIABLES LIKE 'wait_timeout';
If max_connections is set too low, MySQL may reject new connections once the limit is reached.
- Check MySQL Process List Use the SHOW PROCESSLIST command to view current connections and queries. This is useful to see if there are too many connections or queries that are stuck or taking too long.
mysql -u root -p
SHOW PROCESSLIST;
This will show a list of current MySQL processes and their statuses. Look for queries that are stuck or have been running for a long time, which may indicate connection issues or slow queries.
- Test MySQL Connection You can also test the connection to MySQL directly using the mysql command-line client. This will help you verify whether the server is accepting connections and if the login credentials are correct.
mysql -u your_user -p
Replace your_user with the appropriate MySQL username. If the connection fails, you'll receive an error message, which can give you more insight into the issue.
- Check for Firewall Issues If the MySQL server is located on a remote machine, ensure that the server is accepting connections on the MySQL port (default is 3306). You can check if the MySQL port is open using telnet:
telnet <mysql_server_ip> 3306
If the connection is successful, it means the MySQL port is open. If the connection fails, you may have a firewall issue either on the MySQL server or the client machine.
- Check Resource Limits (File Descriptors) MySQL might fail to accept new connections if the system runs out of file descriptors. You can check the number of open file descriptors using the following command:
ulimit -n
check Resource Overuse or Crashes
Check MySQL Error Log for Crashes
The MySQL error log often provides information about crashes, restarts, or resource-related issues. To check the error log for crashes or resource overuse, look for relevant entries such as crash, shutdown, or out of memory.
You can search for these terms using grep:
grep -i "crash" /opt/lampp/var/mysql/mysql.err
grep -i "out of memory" /opt/lampp/var/mysql/mysql.err
grep -i "shutdown" /opt/lampp/var/mysql/mysql.err
If MySQL crashes or has resource issues, these messages will likely appear in the log.
- Check MySQL Status for Server Load The mysqladmin command can provide valuable information about MySQL’s status, including server load, number of threads, and queries being executed:
mysqladmin -u root -p status
This will show the current status, including uptime, threads, queries, and more. If the number of threads or queries is unusually high, it could indicate resource strain.
- Check MySQL Slow Query Log If the MySQL server is experiencing high load due to slow queries, enabling and checking the slow query log can help. You can enable the slow query log in MySQL by adding these lines to your my.cnf file (if not already configured):
[mysqld]
slow_query_log = 1
slow_query_log_file = /path_to_log/slow_query.log
long_query_time = 2
This configuration logs queries that take longer than 2 seconds to execute. Once enabled, check the slow query log:
cat /path_to_log/slow_query.log
This will show any long-running queries that may be causing high load.
- Monitor System Resources Using top or htop To check if the system is overusing resources like CPU or memory, you can use top or htop (for more detailed output). These tools display the system’s resource usage in real time:
For top:
top
For htop (if installed):
htop
Look at the MySQL process (usually mysqld) to see if it's consuming excessive CPU or memory. If MySQL is consuming too many resources, you may need to optimize queries, increase resources, or look for underlying issues.
- Check Disk Space Usage MySQL can crash or slow down if the disk is full. You can check disk usage with the df command:
df -h
Look for disk partitions that are 100% full, especially the partition where MySQL data is stored (commonly /var/lib/mysql).
check Review Query Errors or Slow Queries
Enable and Check the Slow Query Log
If you suspect that slow queries are affecting performance, MySQL has a slow query log feature that can help you identify queries that take a long time to execute. Here's how to enable and check the slow query log.
Enable Slow Query Log (if not already enabled)
Open MySQL's configuration file (my.cnf or my.ini) and add or modify the following settings:
[mysqld]
slow_query_log = 1
slow_query_log_file = /path_to_log/slow_query.log
long_query_time = 2
log_queries_not_using_indexes = 1
slow_query_log: Enables the slow query log.
slow_query_log_file: Specifies the file where the slow queries will be logged.
long_query_time: Queries that take longer than this value (in seconds) will be logged. Adjust it according to your needs (default is 10 seconds).
log_queries_not_using_indexes: Logs queries that do not use indexes, which can be a sign of inefficient queries.
After making the changes, restart MySQL to apply them:
sudo systemctl restart mysql
View Slow Query Log
Once the slow query log is enabled and MySQL has logged some queries, you can view the contents using the cat, less, or more commands:
cat /path_to_log/slow_query.log
Or, to search for queries taking longer than the threshold:
grep "Query_time" /path_to_log/slow_query.log
This will show you the queries that have been logged as slow, helping you identify which queries may be causing performance issues.
- Check the General Query Log The general query log records all SQL queries that MySQL processes, including those that result in errors. This log can be helpful if you're troubleshooting query execution or errors.
Enable General Query Log
To enable the general query log, open the MySQL configuration file (my.cnf or my.ini) and add or modify the following settings:
[mysqld]
general_log = 1
general_log_file = /path_to_log/general_query.log
Restart MySQL for the changes to take effect:
sudo systemctl restart mysql
View General Query Log
After enabling the general query log, you can view it using cat, less, or more:
cat /path_to_log/general_query.log
Or, to search for specific query errors or issues:
grep "ERROR" /path_to_log/general_query.log
This will show you any errors related to query execution. Note that the general query log can grow very quickly, so it’s recommended to disable it in production environments after troubleshooting.
- Check for Query Errors in MySQL Error Log MySQL’s error log can provide information on query execution errors. To check for errors related to queries, you can search the error log for query or error entries.
grep -i "query" /opt/lampp/var/mysql/mysql.err
grep -i "error" /opt/lampp/var/mysql/mysql.err
This will give you any relevant error messages related to queries, such as syntax errors or constraint violations.
- Check for Query Errors Using SHOW WARNINGS If a query was executed but generated warnings (rather than errors), you can retrieve the warnings by running the following command after executing a query:
SHOW WARNINGS;
This will display the warnings for the last executed query. If there are no warnings, it will return an empty result.
- Use EXPLAIN to Analyze Queries The EXPLAIN command helps you understand how MySQL executes a query and can identify inefficient query plans. This can help you understand if a query is performing poorly due to a missing index, for example.
EXPLAIN SELECT * FROM your_table WHERE column_name = 'value';
This will show you the query execution plan. Look for signs of inefficiency such as a "Full Table Scan" or "Using temporary" in the output. Adding appropriate indexes or rewriting the query can help improve performance.
- Monitor Query Performance with SHOW STATUS You can use the SHOW STATUS command to monitor overall query performance. It provides information on how many queries have been executed and how long they take.
For example, to monitor the number of queries executed:
SHOW STATUS LIKE 'Queries';
To monitor slow queries:
SHOW STATUS LIKE 'Slow_queries';
You can also monitor the number of queries that are not using indexes, which could indicate performance issues:
SHOW STATUS LIKE 'Handler_read_rnd_next';
- Check MySQL’s INFORMATION_SCHEMA for Query Metrics The INFORMATION_SCHEMA provides a detailed view of your database's performance and queries. To view the most resource-intensive queries, you can run:
SELECT * FROM INFORMATION_SCHEMA.PROCESSLIST;
This will show you the current queries being executed by MySQL, along with their status and duration. This is useful for identifying queries that are taking too long or causing delays.
Third-party tools
- New Relic: Provides performance monitoring and query analysis for various databases.
- Datadog: Offers database performance monitoring and query analysis.
- Prometheus: A monitoring system that can be used to track database performance and query metrics.
- Grafana: A visualization tool that can be used to display database performance and query metrics.
- Query Monitor (WordPress plugin): Analyzes and debugs WordPress database queries.
- SQL Sentry: Provides performance monitoring and query analysis for SQL Server.
- DB2 Query Analyzer (IBM): Analyzes and optimizes DB2 queries.
Log analysis tools
- Logstash: A log aggregation and analysis tool.
- Splunk: A log analysis and monitoring platform.
- ELK Stack (Elasticsearch, Logstash, Kibana): A log analysis and visualization platform.
Command-line tools
- *mysqlsla *(MySQL): Analyzes MySQL slow query logs.
- pg_fiddle (PostgreSQL): Analyzes PostgreSQL query plans.
sqlparse: A command-line tool for parsing and analyzing SQL queries.
mysqlsla: Analyzes MySQL slow query logs.
Example: mysqlsla -lt slow-query.logmysqldumpslow: Analyzes MySQL slow query logs.
Example: mysqldumpslow -s c -t 10 slow-query.logmysql_explain: Analyzes MySQL query execution plans.
Example: mysql_explain -u root -p password -h localhost -e "EXPLAIN SELECT * FROM table_name"

Top comments (0)