Grafana is a popular open-source platform for monitoring and visualizing data. It can be used to monitor Linux systems as well, and in this tutorial, I'll show you how to set up a Linux system monitoring dashboard in Grafana.
Prerequisites:
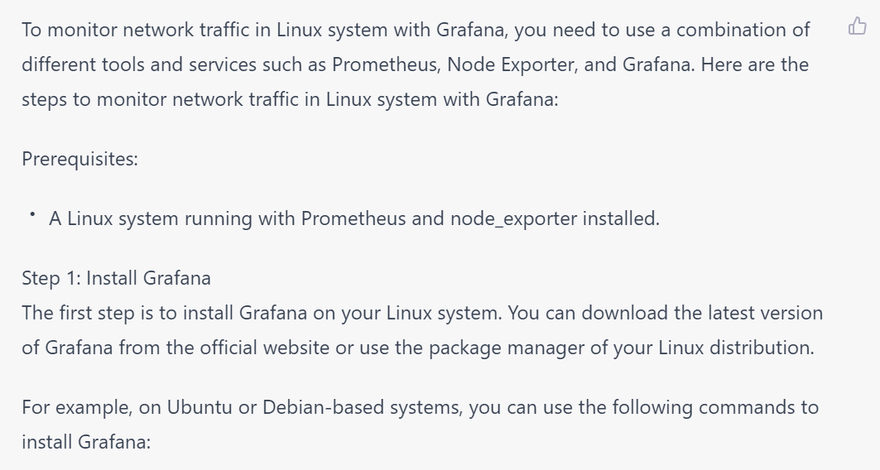
A Linux system running with Prometheus and node_exporter installed.
Step 1: Install Grafana
The first step is to install Grafana on your Linux system. You can download the latest version of Grafana from the official website or use the package manager of your Linux distribution.
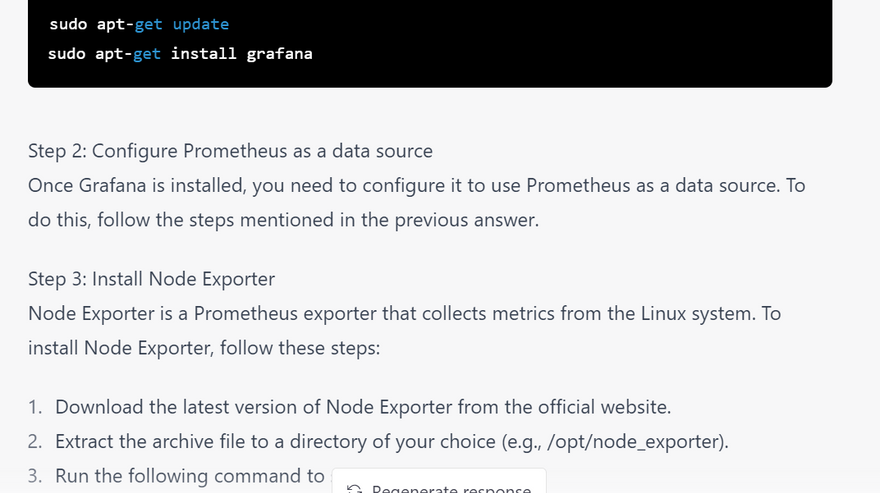
For example, on Ubuntu or Debian-based systems, you can use the following commands to install Grafana:
sudo apt-get update
sudo apt-get install grafana
how-to-monitor-network traffic in linux-system-with--grafana
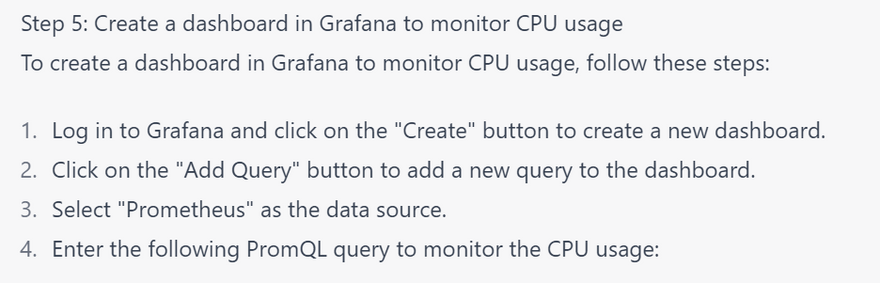
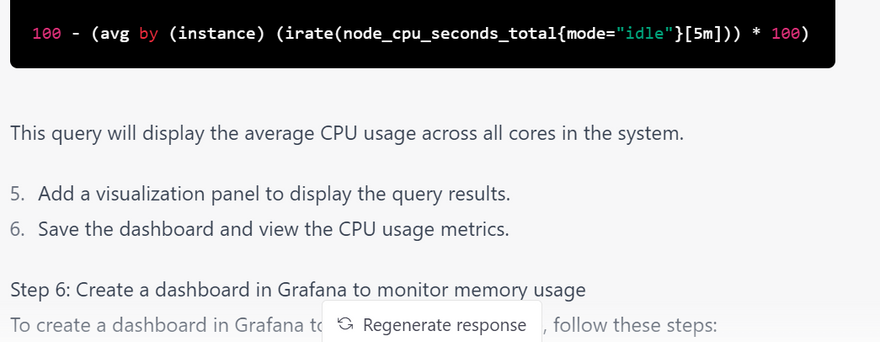
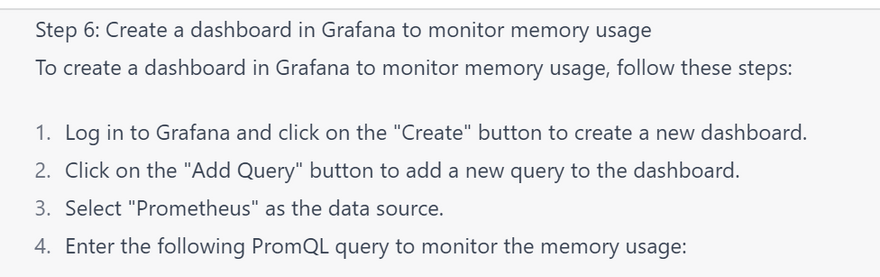
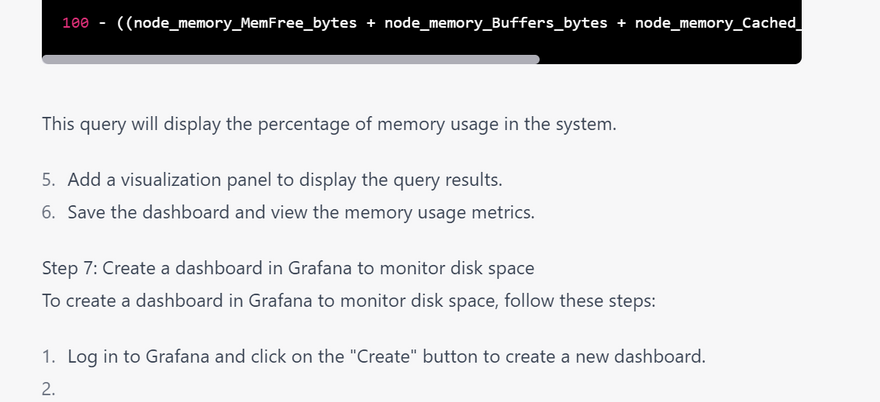
how-to-monitor- CPU usage, memory usage, disk space in linux-system-with--grafana
repeat above steps upto Install Node Exporter

Top comments (0)