Among the following identify the one in which dimensionality reduction reduces.
a) Performance
b) statistics
c) Entropy
d) Collinearity
answer: d- Collinearity
Which of the following machine learning algorithm is based upon the idea of bagging?
a) Decision Tree
b) Random Forest
c) Classfication
d) SVM
answer: a- Decision Tree
Choose a disadvantage of decision trees among the following.
a) Decision tree robust to outliers
b) Factor analysis
c) Decision Tree are prone to overfit
d) all of the above
answer: c Decision tree robust to outliers
Decision trees have a tendency to overfit the training data, which means they can create complex and highly specialized models that perform well on the training data but poorly on unseen or new data. This is a disadvantage of decision trees because it can lead to poor generalization to new examples and reduced model accuracy. Regularization techniques, pruning, or using ensemble methods like Random Forests can help mitigate this issue.
What is the term known as on which the machine learning algorithms build a model based on
sample data?
a) Data Training
b) Sample Data
c) Training data
d) None of the above
answer: c Training data
Which of the following machine learning techniques helps in detecting the outliers in data?
a) Clustering
b) Classification
c) Anamoly detection
d) All of the above
answer: c Anamoly detection
c) Anomaly detection
Anomaly detection is a machine learning technique specifically designed for detecting outliers or anomalies in data. It focuses on identifying data points that deviate significantly from the majority of the data, making it a suitable method for outlier detection. Clustering and classification can also indirectly help identify outliers, but they are not specialized techniques for this purpose.
Identify the incorrect numerical functions in the various function representation of machine
learning.
a) Support Vector
b) Regression
c) Case based
d) Classification
answer: c Case based
c) Case based
"Case-based" does not represent a numerical function in the context of machine learning. The other options, a) Support Vector, b) Regression, and d) Classification, are types of machine learning algorithms or techniques that are associated with numerical functions for various purposes:
Support Vector Machines (SVMs) are used for classification and can be associated with specific mathematical functions.
Regression involves finding the relationship between input variables and continuous target variables, typically represented by numerical functions.
Classification algorithms aim to assign input data points to predefined classes or categories based on numerical functions or decision boundaries.
Analysis of ML algorithm needs
a) Statistical learning theory
b) Computational learning theory
c) None of the above
d) Both a and b
answer: d Both a and b
The correct answer is:
d) Both a and b
Analysis of machine learning algorithms often requires both statistical learning theory and computational learning theory.
Statistical learning theory provides insights into the theoretical properties of algorithms, such as their ability to generalize from data, error bounds, and performance guarantees. It deals with the statistical properties of data and the relationships between the data, the learning algorithm, and the model's performance.
Computational learning theory focuses on the computational aspects of machine learning, including algorithmic efficiency, optimization techniques, and the computational complexity of learning algorithms.
Both these theories are important for a comprehensive understanding of machine learning algorithms and their behavior.
Identify the difficulties with the k-nearest neighbor algorithm.
a) Curse of dimensionality
b) Calculate the distance of test case for all training cases
c) Both a and b
d) None
answer: c Both a and b
The correct answer is:
c) Both a and b
The k-nearest neighbor (KNN) algorithm can encounter difficulties related to the curse of dimensionality (option a) and the need to calculate the distance of a test case to all training cases (option b).
a) Curse of dimensionality: As the number of dimensions (features) in the data increases, the performance of KNN can degrade due to the increased computational requirements and the diminishing effectiveness of distance-based similarity measures in high-dimensional spaces.
b) Calculating the distance of a test case for all training cases: KNN involves calculating the distance (e.g., Euclidean distance) between a test data point and all training data points. This can be computationally expensive, especially when dealing with large datasets.
Both of these challenges are considerations when using the KNN algorithm, and practitioners often need to address them through techniques like dimensionality reduction or optimizing distance calculations for efficiency.
The total types of the layer in radial basis function neural networks is ______
a) 1
b) 2
c) 3
d) 4
answer: b 2
The total types of layers in a Radial Basis Function (RBF) neural network typically consist of:
b) 2
In an RBF neural network, you typically have an input layer and an RBF hidden layer. There is no separate concept of hidden layers like in feedforward neural networks, and there is typically no output layer because RBF networks are often used for clustering, function approximation, or pattern recognition tasks where the output is directly determined by the RBF units in the hidden layer.
Which of the following is not a supervised learning
a) PCA
b) Naïve bayes
c) Linear regression
d) KMeans
answer: a) PCA
What is unsupervised learning?
a) Number of groups may be known
b) Features of groups explicitly stated
c) Neither feature nor number of groups is known
d) None of the above
answer: c) Neither feature nor number of groups is known
Unsupervised learning is:
c) Neither feature nor the number of groups is known
Unsupervised learning is a type of machine learning where the algorithm is tasked with finding patterns, structures, or relationships in data without explicit supervision or labeled target values. In unsupervised learning, the algorithm explores the data to discover inherent structures or groupings, and it doesn't rely on prior knowledge of the number of groups or specific features of those groups. Clustering and dimensionality reduction are common tasks in unsupervised learning.
Which of the following is not a machine learning algorithm?
a) SVM
b) SVG
c) Random Forest Algorithm
d) None of the above
answer: c) SVG
_______ is the scenario when the model fails to decipher the underlying trend in the input data
a) Overfitting
b) Underfitting
c) Both a and b
d) None of the above
answer: b) Underfitting
b) Underfitting
Underfitting occurs when a model is too simple to capture the underlying trend or patterns in the input data. It typically results in poor performance because the model is not complex enough to represent the data adequately. Overfitting (option a) is the opposite scenario where the model is overly complex and fits the training data too closely, capturing noise and leading to poor generalization.
Real-Time decisions, Game AI, Learning Tasks, Skill acquisition, and Robot Navigation are applications of ............
a) Reinforcement learning
b) Supervised learning
c) Unsupervised Learning
d) None of the above
answer: a) Reinforcement learning
a) Reinforcement learning
Applications such as real-time decisions, game AI, learning tasks, skill acquisition, and robot navigation are commonly associated with reinforcement learning. Reinforcement learning is a type of machine learning where agents learn to make decisions by interacting with an environment and receiving feedback in the form of rewards or penalties. It is well-suited for scenarios where an agent must take a sequence of actions to achieve a goal or maximize a cumulative reward.
What is called the average squared difference between classifier predicted output and actual
output?
a) Mean relative error
b) Mean squared error
c) Mean absolute error
d) Root mean squared error
answer: b) Mean squared error
b) Mean squared error
The average squared difference between a classifier's predicted output and the actual output is known as the Mean Squared Error (MSE). It's a commonly used metric for measuring the quality of regression models.
Logistic regression is a ........... regression technique that is used to model data having a ............
outcome.
a) Linear, binary
b) Linear, numeric
c) Nonlinear, binary
d) Nonlinear, numeric
answer: a) Linear, binary
a) Linear, binary
Logistic regression is a linear regression technique that is used to model data having a binary outcome, where the outcome variable is categorical and has two classes, typically represented as 0 and 1. It is often used for binary classification problems.
You are given reviews of few netflix series marked as positive, negative and neutral. Classifying
reviews of a new netflix series is an example of
A. supervised learning
B. unsupervised learning
C. semisupervised learning
D. reinforcement learning
answer: a) supervised learning
Classifying reviews of a new Netflix series is an example of:
In supervised learning, a machine learning model is trained on a labeled dataset where the input data (reviews in this case) is associated with the corresponding output labels (positive, negative, neutral). Once trained, the model can classify new, unseen reviews based on what it learned during training.
Following is powerful distance metrics used by Geometric model
A. euclidean distance
B. manhattan distance
C. both a and b
D. square distance
answer: c) . both a and b
59) Which of the following techniques would perform better for reducing dimensions of a data set?
A. removing columns which have too many missing values
B. removing columns which have high variance in data
C. removing columns with dissimilar data trends
D. none of these
answer: b) . removing columns which have high variance in data
60) Supervised learning and unsupervised clustering both require which is correct according to the
statement.
A. output attribute.
B. hidden attribute.
C. input attribute.
D. categorical attribute
answer: c) input attribute
61) What is the meaning of hard margin in SVM?
(A) SVM allows very low error in classification
(B) SVM allows high amount of error in classification
(C) Underfitting
(D) SVM is highly flexible
answer: a) SVM allows very low error in classification
62)
Increase in which of the following hyper parameter results into overfit in Random forest?
(1). Number of Trees.
(2). Depth of Tree,
(3). Learning Rate
(A) Only 1
(B) Only 2
(C) 2 and 3
(D) 1,2 and 3
answer: b) Only 2
63)
Below are the 8 actual values of target variable in the train file: [0,0,0, 0, 1, 1,1,1,1,1], What is the
entropy of the target variable?
(A) -(6/10 log(6/10) + 4/10 log(4/10))
(B) 6/10 log(6/10) + 4/10 log(4/10)
(C) 4/10 log(6/10) + 6/10 log(4/10)
(D) 6/10 log(4/10) – 4/10 log(6/10)
answer: a) -(6/10 log(6/10) + 4/10 log(4/10))
64) Lasso can be interpreted as least-squares linear regression where
(A) weights are regularized with the l1 norm
(B) weights are regularized with the l2 norm
(C) the solution algorithm is simpler
answer: a) weights are regularized with the l1 norm
65) Consider the problem of binary classification. Assume I trained a model on a linearly separable
training set, and now I have a new labeled data point that the model properly categorized and is far
away from the decision border. In which instances is the learnt decision boundary likely to change if I
now add this additional point to my previous training set and re-train? When the training model is,
(A) Perceptron and logistic regression
(B) Logistic regression and Gaussian discriminant analysis
(C) Support vector machine(D) Perceptron
answer: b) Logistic regression and Gaussian discriminant analysis
*66) Assume you’ve discovered multi-collinear features. Which of the following actions do you *
intend to take next? (1). Both collinear variables should be removed. (2). Instead of deleting both
variables, we can simply delete one. (3). Removing correlated variables may result in information
loss. We may utilize penalized regression models such as ridge or lasso regression to keep such
variables.
(A) Only 1
(B) Only 2
(C) Either 1 or 3
(D) Either 2 or 3
answer: d) Logistic regression and Gaussian discriminant analysis
67)
A least squares regression study of weight (y) and height (x) yielded the following least squares line:
y = 120 + 5x. This means that if the height is increased by one inch, the weight should increase by
what amount?
(A) increase by 1 pound
(B) increase by 5 pound
(C) increase by 125 pound
(D) None of the above
answer: b) increase by 5 pound
68)
The line described by the linear regression equation (OLS) attempts to ____?
(A) Pass through as many points as possible.
(B) Pass through as few points as possible
(C) Minimize the number of points it touches
(D) Minimize the squared distance from the points
answer: d) Minimize the squared distance from the points
69)
For two real-valued attributes, the correlation coefficient is 0.85. What does this value indicate?
(A) The attributes are not linearly related
(B) As the value of one attribute increases the value of the second attribute also increases
(C) As the value of one attribute decreases the value of the second attribute increases
(D) The attributes show a curvilinear relationship70)
answer: b) As the value of one attribute increases the value of the second attribute also increases
Which neural network architecture would be most suited to handle an image identification problem
(recognizing a dog in a photo)?
(A) Multi Layer Perceptron
(B) Convolutional Neural Network
(C) Recurrent Neural network
(D) Perceptron.
answer: b) Convolutional Neural Network
Model classification evaluation Objective
What is the purpose of model classification evaluation in machine learning?
a. Feature selection
b. Model training
c. Assessing model performance [Correct Answer]
d. Data preprocessing
Which metric is commonly used for binary classification to measure a model's accuracy?
a. Mean Absolute Error
b. F1-Score
c. R-squared
d. Accuracy [Correct Answer]
True or False: Accuracy is always a suitable metric for evaluating a classification model.
a. True
b. False [Correct Answer]
Which metric is useful for imbalanced datasets and focuses on the model's ability to correctly identify positive cases?
a. Precision [Correct Answer]
b. Recall
c. F1-Score
d. ROC-AUC
What does the ROC curve show in classification evaluation?
a. The trade-off between precision and recall
b. The model's confusion matrix
c. The relationship between true positives and false positives [Correct Answer]
d. The distribution of target classes
In a ROC curve, what is the ideal position for a classifier?
a. Top-left corner [Correct Answer]
b. Bottom-right corner
c. Bottom-left corner
d. Top-right corner
Which metric combines precision and recall into a single value?
a. ROC-AUC
b. F1-Score [Correct Answer]
c. Accuracy
d. Mean Absolute Error
In the context of classification, what is overfitting?
a. The model is too simple and lacks predictive power
b. The model fits the training data too closely and may not generalize well to new data [Correct Answer]
c. The model is undertrained
d. The model is perfectly balanced
Which metric is sensitive to the total number of true negatives?
a. Precision
b. Recall
c. F1-Score
d. Specificity [Correct Answer]
Which of the following is NOT a common threshold for binary classification?
a. 0.5
b. 0.25
c. 1.0
d. -1.0 [Correct Answer]
In a confusion matrix, which cell represents the true positives?
a. Top-left
b. Top-right
c. Bottom-left
d. Bottom-right [Correct Answer]
What does the term "cross-validation" refer to in model evaluation?
a. Dividing the data into training and testing sets
b. Repeating the model evaluation process with different train-test splits [Correct Answer]
c. Checking for multicollinearity
d. Feature engineering
What is the purpose of a validation set in model evaluation?
a. It's used for training the model.
b. It's used to tune hyperparameters and estimate model performance on unseen data [Correct Answer].
c. It's used for calculating the accuracy of the model.
d. It's not used in model evaluation.
Which metric is best suited for a highly imbalanced dataset where false positives are costly?
a. Precision
b. Recall
c. ROC-AUC
d. F1-Score [Correct Answer]
Which of the following is NOT a classification threshold technique?
a. ROC Curve
b. Precision-Recall Curve
c. Receiver Operating Characteristic
d. Elbow Method [Correct Answer]
What is the formula for the F1-Score?
a. F1 = (2 * Precision * Recall) / (Precision + Recall)
b. F1 = Precision - Recall
c. F1 = Precision + Recall
d. F1 = Precision / Recall [Correct Answer]
Which metric measures the balance between precision and recall?
a. ROC-AUC
b. F1-Score [Correct Answer]
c. Accuracy
d. Specificity
What does a high F1-Score indicate about a model's performance?
a. High precision and high recall
b. High precision but low recall
c. Low precision but high recall
d. A balance between precision and recall [Correct Answer]
True or False: ROC-AUC is a threshold-independent metric.
a. True [Correct Answer]
b. False
Which of the following is NOT a limitation of accuracy as a metric for classification?
a. It doesn't consider false positives and false negatives.
b. It doesn't account for class imbalances.
c. It's sensitive to the choice of threshold.
d. It's not suitable for imbalanced datasets. [Correct Answer]
In a precision-recall curve, what does a point at (1, 1) indicate?
a. Perfect precision and perfect recall [Correct Answer]
b. Low precision and low recall
c. High precision but low recall
d. High recall but low precision
Which of the following can help address class imbalance in classification?
a. Oversampling the minority class [Correct Answer]
b. Undersampling the majority class
c. Ignoring the minority class
d. Using accuracy as the primary metric
What is the range of values for ROC-AUC?
a. 0 to 1 [Correct Answer]
b. -1 to 1
c. 0 to 100
d. 1 to 100
Which metric is calculated as the ratio of true positives to the total number of actual positives?
a. Accuracy
b. Precision
c. Recall [Correct Answer]
d. F1-Score
True or False: In k-fold cross-validation, each fold serves as both a training and testing set.
a. True
b. False [Correct Answer]
Which metric focuses on the ability of a classifier to distinguish between different classes?
a. F1-Score
b. ROC-AUC
c. Specificity
d. Gini Index [Correct Answer]
What is the Gini Index used for in decision trees and random forests?
a. Measuring model accuracy
b. Ranking feature importance [Correct Answer]
c. Calculating precision and recall
d. Estimating class probabilities
Which metric is a measure of how well a binary classification model ranks true positives higher than false positives?
a. Precision-Recall Curve
b. ROC Curve
c. Area Under the ROC Curve (ROC-AUC) [Correct Answer]
d. Confusion Matrix
Which evaluation metric is commonly used for multi-class classification problems?
a. ROC-AUC
b. F1-Score
c. Cross-Entropy Loss [Correct Answer]
d. Specificity
Which metric is also known as the True Negative Rate?
a. Precision
b. Recall
c. Specificity [Correct Answer]
d. F1-S
Linear Regression Objective Qustion
What type of machine learning problem does linear regression primarily address?
a. Classification
b. Regression [Correct Answer]
c. Clustering
d. Reinforcement learning
In linear regression, what is the objective variable typically referred to as?
a. Predictor variable
b. Independent variable
c. Dependent variable [Correct Answer]
d. Feature variable
Which type of linear regression is used when there is only one predictor variable?
a. Simple linear regression [Correct Answer]
b. Multiple linear regression
c. Polynomial regression
d. Ridge regression
True or False: In linear regression, the relationship between the predictor variables and the target variable is assumed to be linear.
a. True [Correct Answer]
b. False
What is the goal of linear regression?
a. To maximize accuracy
b. To minimize the sum of squared residuals [Correct Answer]
c. To maximize precision
d. To minimize overfitting
What is the equation for a simple linear regression model with one predictor variable (x) and one target variable (y)?
a. y = mx + b
b. y = a + bx
c. y = ax + b [Correct Answer]
d. y = b - mx
What does "m" represent in the equation of a simple linear regression model (y = ax + b)?
a. The y-intercept (b)
b. The slope of the line (a) [Correct Answer]
c. The target variable (y)
d. The predictor variable (x)
What is the goal of linear regression training?
a. To find the best predictor variables
b. To estimate the coefficients (parameters) of the model that minimize the loss function [Correct Answer]
c. To maximize the correlation between variables
d. To increase the number of predictor variables
What is the most common method for estimating the coefficients in linear regression?
a. Gradient boosting
b. Maximum likelihood estimation
c. Ordinary least squares (OLS) [Correct Answer]
d. Ridge regression
What is the loss function minimized in linear regression?
a. Cross-entropy loss
b. Mean Absolute Error (MAE)
c. Mean Squared Error (MSE) [Correct Answer]
d. Logarithmic loss
In linear regression, what does the residual represent?
a. The predicted values
b. The difference between the actual and predicted values [Correct Answer]
c. The sum of squared errors
d. The correlation between variables
What does the coefficient of determination (R-squared) measure in linear regression?
a. The accuracy of the model
b. The variance explained by the model [Correct Answer]
c. The sum of squared residuals
d. The slope of the regression line
What does an R-squared value of 0 indicate in linear regression?
a. The model is a perfect fit.
b. None of the variance in the target variable is explained by the model.
c. The model explains all the variance in the target variable. [Correct Answer]
d. The model is overfitting.
True or False: Linear regression is robust to outliers.
a. True
b. False [Correct Answer]
What is the purpose of feature scaling in linear regression?
a. To improve model interpretability
b. To prevent overfitting
c. To standardize the range of predictor variables [Correct Answer]
d. To add more predictor variables
In multiple linear regression, how are multiple predictor variables typically represented?
a. As a single combined variable
b. As separate variables with separate coefficients [Correct Answer]
c. As a polynomial equation
d. As categorical variables
What is multicollinearity in the context of multiple linear regression?
a. A type of regression technique
b. The presence of strong correlations among predictor variables [Correct Answer]
c. The absence of predictor variables
d. A measure of model accuracy
What is the purpose of regularization techniques like Ridge and Lasso regression?
a. To increase model complexity
b. To reduce the number of predictor variables
c. To prevent overfitting by adding a penalty term to the loss function [Correct Answer]
d. To maximize R-squared
What does the term "homoscedasticity" refer to in linear regression?
a. A type of regression model
b. The assumption that residuals have constant variance across all levels of predictor variables [Correct Answer]
c. The assumption that residuals have normal distribution
d. The presence of outliers in the data
What is the primary limitation of linear regression when modeling complex relationships?
a. It cannot handle categorical variables.
b. It cannot model nonlinear relationships effectively. [Correct Answer]
c. It is computationally intensive.
d. It cannot handle missing data.
Which of the following is a potential solution to the problem of heteroscedasticity in linear regression?
a. Adding more predictor variables
b. Transforming the target variable
c. Weighted least squares regression [Correct Answer]
d. Removing outliers
In logistic regression, what type of outcome variable is typically used?
a. Continuous variable
b. Binary or categorical variable [Correct Answer]
c. Ordinal variable
d. Time series variable
What is the primary difference between linear regression and logistic regression?
a. Linear regression is used for classification, while logistic regression is used for regression.
b. Linear regression models the relationship between predictor variables and a continuous target variable, while logistic regression models the probability of a binary outcome. [Correct Answer]
c. Linear regression is always a linear model, while logistic regression can be nonlinear.
d. Linear regression cannot handle categorical variables.
In logistic regression, what is the logistic function (sigmoid function) used for?
a. To compute the mean squared error
b. To transform the target variable
c. To model the probability of a binary outcome [Correct Answer]
d. To calculate R-squared
Which metric is commonly used to evaluate the performance of logistic regression models?
a. Mean Absolute Error (MAE)
b. Root Mean Squared Error (RMSE)
c. Accuracy
d. Area Under the ROC Curve (ROC-AUC) [Correct Answer]
In linear regression, what happens to the relationship between predictor and target variables if the coefficient of a predictor variable is zero?
a. The predictor variable becomes irrelevant.
b. The model becomes underfit.
c. The model's performance improves.
d. Nothing changes in the relationship. [Correct Answer]
What is the primary advantage of using polynomial regression over simple linear regression?
a. Polynomial regression is more interpretable.
b. Polynomial regression handles multicollinearity better.
c. Polynomial regression
What is the primary purpose of evaluating a linear regression model?
a. To select the best features
b. To estimate coefficients
c. To assess its performance and goodness of fit [Correct Answer]
d. To visualize data patterns
What is the most common metric used to evaluate the goodness of fit in linear regression?
a. Mean Absolute Error (MAE)
b. Root Mean Squared Error (RMSE)
c. R-squared (Coefficient of Determination) [Correct Answer]
d. F1-Score
In linear regression, what does the R-squared value represent?
a. The sum of squared residuals
b. The variance of the target variable
c. The proportion of variance in the target variable explained by the model [Correct Answer]
d. The standard error of the model
True or False: A higher R-squared value always indicates a better-fitting linear regression model.
a. True
b. False [Correct Answer]
What is the range of values for R-squared?
a. -∞ to ∞
b. -1 to 1
c. 0 to 1 [Correct Answer]
d. 1 to 100
What is the primary limitation of using R-squared as a sole evaluation metric for linear regression?
a. It cannot handle continuous variables.
b. It is sensitive to outliers.
c. It does not provide information about prediction errors and bias. [Correct Answer]
d. It requires multicollinearity.
What is the purpose of residual analysis in linear regression?
a. To calculate R-squared
b. To identify patterns or trends in the residuals to assess model assumptions and adequacy [Correct Answer]
c. To estimate coefficients
d. To select the best features for the model
Which diagnostic plot is commonly used to assess the normality of residuals in linear regression?
a. Scatterplot
b. Histogram of residuals
c. Q-Q plot (Quantile-Quantile plot) [Correct Answer]
d. Boxplot
What does the Durbin-Watson statistic measure in the context of linear regression?
a. The level of multicollinearity among predictor variables
b. The normality of the residuals
c. The presence of autocorrelation in the residuals [Correct Answer]
d. The degree of heteroscedasticity in the data
In linear regression, what is the purpose of leverage and influence analysis?
a. To identify outliers in the residuals
b. To assess the linearity of the relationship between predictor and target variables
c. To identify data points that have a strong impact on the model's coefficients and predictions [Correct Answer]
d. To evaluate the normality of the residuals
What is the primary goal of heteroscedasticity detection and remediation in linear regression?
a. To improve model interpretability
b. To ensure that predictor variables are independent
c. To ensure that the residuals have constant variance across all levels of predictor variables
d. To make the model's predictions more accurate by addressing non-constant variance in residuals [Correct Answer]
Which of the following is NOT a common metric used to evaluate the performance of a linear regression model?
a. Mean Absolute Error (MAE)
b. Root Mean Squared Error (RMSE)
c. R-squared (Coefficient of Determination)
d. F1-Score [Correct Answer]
True or False: In linear regression, multicollinearity among predictor variables is desirable because it improves model accuracy.
a. True
b. False [Correct Answer]
When using cross-validation to evaluate a linear regression model, what is the purpose of k-fold cross-validation?
a. To ensure that the model has the same number of predictor variables as observations
b. To estimate how well the model will generalize to unseen data by partitioning the data into k subsets [Correct Answer]
c. To calculate the R-squared value more accurately
d. To identify influential outliers in the dataset
What is the primary purpose of using k-fold cross-validation when evaluating a linear regression model?
a. To compare different linear regression algorithms
b. To estimate how well the model will generalize to new, unseen data by splitting the data into k subsets and testing on each subset [Correct Answer]
c. To calculate the p-values of predictor variables
d. To assess model assumptions
What is the primary advantage of using Ridge regression over ordinary least squares (OLS) regression?
a. Ridge regression is computationally faster.
b. Ridge regression allows for feature selection by setting some coefficients to zero [Correct Answer].
c. Ridge regression is more interpretable.
d. Ridge regression is less sensitive to outliers.
Which diagnostic plot is used to assess the presence of influential outliers in linear regression?
a. Scatterplot of residuals
b. Normal probability plot
c. Cook's distance plot [Correct Answer]
d. Q-Q plot
In linear regression, what does the AIC (Akaike Information Criterion) measure when comparing models?
a. Model bias
b. Model interpretability
c. Model complexity and goodness of fit [Correct Answer]
d. Model accuracy
Which of the following is a potential solution to the problem of multicollinearity in linear regression?
a. Removing predictor variables with low p-values
b. Transforming the target variable
c. Using Ridge regression or Lasso regression [Correct Answer]
d. Adding more predictor variables
What is the primary purpose of the Q-Q plot (Quantile-Quantile plot) in linear regression?
a. To assess the linearity of the relationship between predictor and target variables
b. To identify influential outliers in the dataset
c. To compare the residuals to a normal distribution and assess the normality of residuals [Correct Answer]
d. To visualize the relationship between predictor variables
Regulization Technique
What is regularization in machine learning?
a. A technique to increase model bias
b. A method to decrease model complexity
c. A process of adding noise to the data
d. A method to prevent overfitting by adding a penalty term to the loss function [Correct Answer]
Which of the following is NOT a common regularization technique in machine learning?
a. L1 Regularization
b. L2 Regularization
c. Dropout
d. K-Means [Correct Answer]
In L1 regularization, what type of penalty term is added to the loss function?
a. Quadratic penalty
b. Absolute penalty [Correct Answer]
c. Logarithmic penalty
d. Exponential penalty
What is the primary effect of L2 regularization on the model's coefficients?
a. It encourages some coefficients to be exactly zero.
b. It increases the absolute magnitude of all coefficients.
c. It shrinks the coefficients toward zero, but not to zero. [Correct Answer]
d. It has no effect on the coefficients.
What is the parameter alpha (λ) in the context of regularization?
a. The learning rate
b. The number of iterations
c. The regularization strength [Correct Answer]
d. The number of clusters in k-means clustering
Which of the following models is NOT typically regularized?
a. Linear Regression
b. Logistic Regression
c. Decision Trees
d. Support Vector Machines [Correct Answer]
What is the primary goal of dropout regularization in neural networks?
a. To encourage sparse weight matrices
b. To reduce computational complexity
c. To prevent overfitting by randomly dropping out neurons during training [Correct Answer]
d. To increase the number of neurons in each layer
True or False: Regularization techniques are primarily used to improve training speed.
a. True
b. False [Correct Answer]
Logistic Regression Objective Question
What type of machine learning problem is logistic regression primarily used for?
a. Regression
b. Classification [Correct Answer]
c. Clustering
d. Reinforcement learning
In logistic regression, what is the objective variable typically referred to as?
a. Predictor variable
b. Independent variable
c. Dependent variable [Correct Answer]
d. Feature variable
True or False: Logistic regression is used for modeling linear relationships between predictor variables and continuous target variables.
a. True
b. False [Correct Answer]
What is the logistic function (sigmoid function) used for in logistic regression?
a. To transform the target variable
b. To calculate the R-squared value
c. To model the probability of a binary outcome [Correct Answer]
d. To compute the mean squared error
In logistic regression, what type of outcome variable is typically used?
a. Continuous variable
b. Binary or categorical variable [Correct Answer]
c. Ordinal variable
d. Time series variable
What is the goal of logistic regression?
a. To minimize the sum of squared residuals
b. To maximize the likelihood of the observed data
c. To model the probability of a binary outcome [Correct Answer]
d. To minimize overfitting
What is the equation for logistic regression?
a. y = mx + b
b. y = a + bx
c. y = 1 / (1 + e^-(a + bx)) [Correct Answer]
d. y = bx
In logistic regression, what does the logistic function's output represent?
a. The predicted class label
b. The probability of the positive class [Correct Answer]
c. The mean of the predictor variables
d. The squared residuals
What is the logistic regression model's prediction threshold commonly set to for binary classification?
a. 0.5 [Correct Answer]
b. 0
c. 1
d. -1
Which algorithm is commonly used to estimate the coefficients in logistic regression?
a. Gradient boosting
b. Maximum likelihood estimation [Correct Answer]
c. Ordinary least squares (OLS)
d. Ridge regression
In logistic regression, what is the likelihood function used for?
a. To compute the mean squared error
b. To estimate the coefficients (parameters) that maximize the likelihood of the observed data [Correct Answer]
c. To calculate the p-values of predictor variables
d. To assess multicollinearity among predictor variables
What is the loss function minimized in logistic regression?
a. Cross-entropy loss [Correct Answer]
b. Mean Absolute Error (MAE)
c. Mean Squared Error (MSE)
d. Logarithmic loss
What does the term "log-odds" represent in logistic regression?
a. The probability of the positive class
b. The logarithm of the odds of the positive class [Correct Answer]
c. The sigmoid function's output
d. The predicted class label
What is the purpose of feature scaling in logistic regression?
a. To improve model interpretability
b. To prevent overfitting
c. To standardize the range of predictor variables [Correct Answer]
d. To add more predictor variables
What is the primary evaluation metric used for logistic regression models in classification problems?
a. Mean Absolute Error (MAE)
b. Root Mean Squared Error (RMSE)
c. Accuracy [Correct Answer]
d. R-squared (Coefficient of Determination)
What does the confusion matrix in binary classification represent?
a. The sum of squared errors
b. The distribution of predictor variables
c. The counts of true positives, true negatives, false positives, and false negatives [Correct Answer]
d. The correlation between predictor variables
What is the precision-recall trade-off in logistic regression?
a. A measure of model complexity
b. The trade-off between accuracy and speed
c. The trade-off between precision and recall [Correct Answer]
d. The trade-off between the number of predictor variables
What does the AUC-ROC curve measure in logistic regression?
a. The accuracy of the model
b. The trade-off between precision and recall
c. The relationship between the true positive rate and false positive rate at different thresholds [Correct Answer]
d. The R-squared value of the model
What is the primary limitation of logistic regression when dealing with imbalanced datasets?
a. It cannot handle imbalanced datasets.
b. It tends to overfit on minority classes.
c. It may produce biased predictions due to class imbalance [Correct Answer]
d. It requires more predictor variables.
What is the purpose of regularization techniques like L1 and L2 regularization in logistic regression?
a. To increase model complexity
b. To reduce the number of predictor variables
c. To prevent overfitting by adding a penalty term to the loss function [Correct Answer]
d. To maximize accuracy
Outlier
What are outliers in a dataset?
a. Data points with high variance
b. Data points that are missing
c. Data points that are far from the center of the data distribution [Correct Answer]
d. Data points with low bias
Which statistical measure is commonly used to identify outliers in a univariate dataset?
a. Standard deviation
b. Interquartile range (IQR) [Correct Answer]
c. Mean absolute error
d. Variance
What is the primary concern when dealing with outliers in a dataset?
a. They can cause underfitting.
b. They can lead to incorrect model predictions.
c. They can distort statistical analyses and model performance. [Correct Answer]
d. They are always useful for improving model accuracy.
Which data preprocessing technique can be used to handle outliers by transforming the data to be less sensitive to extreme values?
a. Feature scaling
b. Feature engineering
c. Logarithmic transformation [Correct Answer]
d. One-hot encoding
What is the primary goal of handling outliers in data analysis?
a. To always remove them from the dataset
b. To reduce the variability of the data
c. To ensure that they do not unduly influence the results or models [Correct Answer]
d. To increase the model's complexity
Which type of outlier is an extreme value that is higher than most other values in the dataset?
a. Low outlier
b. High outlier [Correct Answer]
c. Symmetric outlier
d. Central outlier
In a box plot, how are outliers typically represented?
a. As points outside the box and whiskers [Correct Answer]
b. As points within the box
c. As points at the median
d. As points at the mean
Which of the following is NOT a common method for handling outliers?
a. Replacing outliers with the median value
b. Truncating the dataset by removing outliers
c. Ignoring outliers and proceeding with the analysis
d. Transforming the outliers into categorical variables [Correct Answer]
What is the primary reason for identifying and handling outliers in a dataset?
a. To increase the dataset's size
b. To make the data more challenging for machine learning algorithms
c. To ensure the robustness and reliability of data analysis and modeling [Correct Answer]
d. To remove all extreme values from the data
Which of the following best describes the concept of an outlier in a dataset?
a. Any data point that is unusual or unexpected in comparison to the other data points [Correct Answer]
b. A data point that is always correct and should not be questioned
c. The mean of the dataset
d. A data point that is typically found in the center of the data distribution
What are outliers in a dataset?
a. Data points with high variance
b. Data points that are far from the center of the data distribution [Correct Answer]
c. Data points that are missing
d. Data points with low bias
Which statistical measure is commonly used to identify outliers in a univariate dataset?
a. Standard deviation
b. Interquartile range (IQR) [Correct Answer]
c. Mean absolute error
d. Variance
What is the primary concern when dealing with outliers in a dataset?
a. They can cause underfitting.
b. They can lead to incorrect model predictions.
c. They can distort statistical analyses and model performance. [Correct Answer]
d. They are always useful for improving model accuracy.
Which data preprocessing technique can be used to handle outliers by transforming the data to be less sensitive to extreme values?
a. Feature scaling
b. Feature engineering
c. Logarithmic transformation [Correct Answer]
d. One-hot encoding
Underfitting and Overfitting
What is underfitting in the context of machine learning models?
a. The model performs well on both training and testing data.
b. The model fails to capture the underlying patterns in the data and performs poorly on both training and testing data. [Correct Answer]
c. The model is too complex and overfits the training data.
d. The model is perfectly balanced in its predictions.
What is the primary consequence of underfitting a machine learning model?
a. High training error and low testing error
b. High training error and high testing error [Correct Answer]
c. Low training error and high testing error
d. Low training error and low testing error
Which of the following best describes a model that underfits the data?
a. It fits the training data perfectly.
b. It generalizes well to unseen data.
c. It has high bias and low variance. [Correct Answer]
d. It has low bias and high variance.
What can be done to mitigate underfitting in a machine learning model?
a. Increase the model's complexity
b. Decrease the amount of training data
c. Add more features to the model
d. Reduce the model's complexity [Correct Answer]
Overfitting
:
What is overfitting in the context of machine learning models?
a. The model performs well on both training and testing data.
b. The model fails to capture the underlying patterns in the data and performs poorly on both training and testing data.
c. The model is too complex and overfits the training data. [Correct Answer]
d. The model is perfectly balanced in its predictions.
What is the primary consequence of overfitting a machine learning model?
a. High training error and low testing error
b. High training error and high testing error [Correct Answer]
c. Low training error and high testing error
d. Low training error and low testing error
Which of the following best describes a model that overfits the data?
a. It fits the training data perfectly.
b. It generalizes well to unseen data.
c. It has high bias and low variance.
d. It has low bias and high variance. [Correct Answer]
What can be done to mitigate overfitting in a machine learning model?
a. Increase the model's complexity
b. Decrease the amount of training data
c. Add more features to the model
d. Reduce the model's complexity [Correct Answer]
Bias and Variance:
In the context of machine learning, what is bias?
a. The ability of a model to fit the training data closely
b. The difference between the predicted values and the actual values in the training data
c. The error introduced by approximating a real-world problem with a simplified model [Correct Answer]
d. The variability of a model's predictions
What is variance in the context of machine learning?
a. The ability of a model to fit the training data closely
b. The difference between the predicted values and the actual values in the training data
c. The error introduced by approximating a real-world problem with a simplified model
d. The sensitivity of a model to variations in the training data [Correct Answer]
What happens to model bias as model complexity increases?
a. It decreases.
b. It increases.
c. It remains unchanged.
d. It can either increase or decrease, depending on the dataset and problem. [Correct Answer]
What happens to model variance as model complexity increases?
a. It decreases.
b. It increases. [Correct Answer]
c. It remains unchanged.
d. It can either increase or decrease, depending on the dataset and problem.
What is the bias-variance trade-off in machine learning?
a. The balance between training and testing accuracy
b. The trade-off between model bias and model variance [Correct Answer]
c. The trade-off between underfitting and overfitting
d. The trade-off between feature selection and feature engineering
When a model has high bias and low variance, what is likely to occur?
a. The model will underfit the training data.
b. The model will overfit the training data.
c. The model will have low training accuracy.
d. The model will have similar performance on both the training and testing data. [Correct Answer]
What is the primary goal of the bias-variance trade-off in machine learning?
a. To minimize both bias and variance simultaneously
b. To maximize bias and minimize variance
c. To strike a balance between bias and variance to achieve better overall model performance [Correct Answer]
d. To ignore both bias and variance and focus on feature selection
In the bias-variance trade-off, what is the consequence of having too much model complexity?
a. High bias and low variance
b. Low bias and low variance
c. High bias and high variance [Correct Answer]
d. Low bias and high variance
Which of the following statements is true regarding the relationship between bias and variance in machine learning models?
a. Bias and variance are inversely related.
b. Bias and variance are always equal.
c. Reducing bias will always increase variance.
d. Increasing model complexity can increase both bias and variance. [Correct Answer]
What is the primary reason for evaluating both training and testing error when assessing model performance in the context of bias and variance?
a. To determine if the model has high bias or high variance
b. To calculate the p-values of predictor variables
c. To identify outliers in the data
d. To assess the trade-off between bias and variance and detect issues like underfitting or overfitting [Correct Answer]
KNN
Basic Concepts:
What type of machine learning algorithm is k-Nearest Neighbors (k-NN)?
a. Supervised learning
b. Unsupervised learning
c. Semi-supervised learning
d. Instance-based learning [Correct Answer]
In k-NN, what does "k" represent?
a. The number of features in the dataset
b. The number of classes in the classification problem
c. The number of nearest neighbors to consider when making predictions [Correct Answer]
d. The number of iterations for training
How does k-NN make predictions for a new data point in a classification problem?
a. By fitting a linear regression model
b. By calculating the Euclidean distance to the k nearest neighbors and selecting the majority class [Correct Answer]
c. By using gradient descent to optimize a cost function
d. By applying principal component analysis (PCA)
In k-NN, how is the distance between data points typically calculated?
a. Cosine similarity
b. Jaccard distance
c. Euclidean distance [Correct Answer]
d. Manhattan distance
Parameter Selection:
What is the primary hyperparameter in k-NN that needs to be chosen before making predictions?
a. The number of features
b. The number of classes
c. The number of nearest neighbors (k) [Correct Answer]
d. The learning rate
What happens if you choose a small value for k in k-NN (e.g., k = 1)?
a. The model becomes more robust to noise in the data.
b. The model becomes more sensitive to individual data points and may be overly influenced by outliers. [Correct Answer]
c. The model's accuracy increases significantly.
d. The model's training time decreases.
What is the effect of choosing a large value for k in k-NN (e.g., k = 50)?
a. The model becomes more sensitive to individual data points.
b. The model becomes less sensitive to noise and outliers. [Correct Answer]
c. The model's accuracy decreases.
d. The model's training time increases significantly.
How can you choose the optimal value of k in k-NN?
a. By selecting the smallest odd number for k
b. By performing cross-validation and choosing the k that results in the best performance on a validation set [Correct Answer]
c. By setting k to be equal to the number of data points in the dataset
d. By using the square root of the number of features as k
In k-NN, what does the parameter "k" control?
a. The number of features in the dataset
b. The number of nearest neighbors to consider when making predictions [Correct Answer]
c. The learning rate of the model
d. The number of classes in the classification problem
How can you choose the optimal value of "k" in k-NN?
a. By selecting the smallest odd number for "k"
b. By performing cross-validation and choosing the "k" that results in the best performance on a validation set [Correct Answer]
c. By setting "k" to be equal to the number of data points in the dataset
d. By using the square root of the number of features as "k"
What is the potential consequence of choosing a very small value for "k" in k-NN?
a. The model becomes more robust to noise in the data.
b. The model becomes more sensitive to individual data points and may be overly influenced by outliers. [Correct Answer]
c. The model's accuracy increases significantly.
d. The model's training time decreases.
What is the potential consequence of choosing a very large value for "k" in k-NN?
a. The model becomes more sensitive to individual data points.
b. The model becomes less sensitive to noise and outliers. [Correct Answer]
c. The model's accuracy decreases.
d. The model's training time increases significantly.
What is the general rule of thumb for selecting an appropriate value for "k" in k-NN?
a. Choose the smallest even number for "k" to achieve balanced predictions.
b. Select a value of "k" that is equal to the number of features in the dataset.
c. Experiment with different values of "k" and choose the one that gives the best trade-off between bias and variance. [Correct Answer]
d. Always set "k" to be an odd number.
How does the choice of "k" affect the bias and variance of a k-NN model?
a. Smaller "k" values increase bias and decrease variance.
b. Smaller "k" values decrease bias and increase variance. [Correct Answer]
c. Larger "k" values increase both bias and variance.
d. Larger "k" values decrease both bias and variance.
What is the danger of selecting "k" too small in k-NN?
a. The model becomes too complex and may overfit the data.
b. The model becomes less interpretable.
c. The model may be overly influenced by noise and outliers in the data. [Correct Answer]
d. The model's training time becomes excessively long.
How can you visualize the impact of different "k" values on model performance in k-NN?
a. By creating a confusion matrix
b. By plotting a learning curve
c. By plotting a validation curve [Correct Answer]
d. By calculating the R-squared value
In k-NN, if you select a very small value for "k" (e.g., k = 1), what is the likely outcome when making predictions?
a. The model will produce accurate and stable predictions.
b. The model will be robust to outliers.
c. The model will be highly sensitive to individual data points and may produce noisy predictions. [Correct Answer]
d. The model will have a low training time.
What is the purpose of parameter tuning in k-NN?
a. To increase the number of features in the dataset
b. To improve model interpretability
c. To find the optimal value of "k" and distance metric for the k-NN model [Correct Answer]
d. To add more training data to the model
When conducting parameter tuning for "k" in k-NN, what values should you consider for "k"?
a. Only even values
b. Any positive integer value
c. A range of values, typically odd integers [Correct Answer]
d. Only prime numbers
What does it mean if you observe a high training error but low testing error when tuning the "k" parameter in k-NN?
a. The model is underfitting the training data.
b. The model is overfitting the training data.
c. The chosen "k" value may be too large. [Correct Answer]
d. The chosen "k" value may be too small.
What is grid search used for in parameter selection for k-NN?
a. To visualize the data distribution
b. To search for the best combination of hyperparameters, including "k" [Correct Answer]
c. To calculate the model's R-squared value
d. To plot the learning curve of the model
When performing grid search for "k" in k-NN, how is the optimal value of "k" determined?
a. It is chosen randomly from a predefined range.
b. It is the "k" value that results in the lowest training error.
c. It is the "k" value that results in the best cross-validation performance based on a specified scoring metric. [Correct Answer]
d. It is the largest odd number in the dataset.
In k-NN, why is it essential to evaluate the model using cross-validation during parameter selection?
a. Cross-validation is optional and not necessary for k-NN.
b. Cross-validation provides a single performance estimate, which is sufficient for model selection.
c. Cross-validation helps ensure that the choice of "k" is robust and generalizes well to unseen data. [Correct Answer]
d. Cross-validation increases the training time of the model.
Distance Metrics:
Which distance metric is commonly used in k-NN for continuous numerical data?
a. Cosine similarity
b. Jaccard distance
c. Euclidean distance [Correct Answer]
d. Manhattan distance
When should you consider using the Manhattan distance metric instead of the Euclidean distance metric in k-NN?
a. When the dataset contains categorical variables
b. When the dataset contains only binary features
c. When the features have different units or scales [Correct Answer]
d. When the dataset is very high-dimensional
Which distance metric is suitable for text data or other high-dimensional sparse data?
a. Euclidean distance
b. Hamming distance
c. Cosine similarity [Correct Answer]
d. Minkowski distance
In k-NN, what is the purpose of a distance metric?
a. To determine the number of nearest neighbors (k)
b. To calculate the model's accuracy
c. To measure the similarity or dissimilarity between data points [Correct Answer]
d. To select the most important features
Which distance metric is commonly used in k-NN for continuous numerical data?
a. Cosine similarity
b. Jaccard distance
c. Euclidean distance [Correct Answer]
d. Manhattan distance
In k-NN, what does the Euclidean distance metric measure between two data points in a multidimensional space?
a. The angle between the data points
b. The absolute difference between their values
c. The straight-line distance or "as-the-crow-flies" distance [Correct Answer]
d. The intersection of their sets
When should you consider using the Manhattan distance metric instead of the Euclidean distance metric in k-NN?
a. When the dataset contains categorical variables
b. When the dataset contains only binary features
c. When the features have different units or scales [Correct Answer]
d. When the dataset is very high-dimensional
What is the primary advantage of using the Manhattan distance metric in k-NN?
a. It is computationally less expensive than other distance metrics.
b. It is more suitable for continuous numerical data.
c. It is less sensitive to the presence of outliers in the data. [Correct Answer]
d. It produces more accurate distance calculations.
Which distance metric is suitable for text data or other high-dimensional sparse data?
a. Euclidean distance
b. Hamming distance
c. Cosine similarity [Correct Answer]
d. Minkowski distance
What does the cosine similarity distance metric measure between two vectors in k-NN?
a. The angle between the vectors [Correct Answer]
b. The absolute difference between their values
c. The straight-line distance
d. The intersection of their sets
In k-NN, when is the cosine similarity distance metric particularly useful?
a. When the dataset contains only binary features
b. When the dataset is very low-dimensional
c. When the magnitude of the vectors matters more than their direction [Correct Answer]
d. When the dataset is highly imbalanced
Which distance metric is used when dealing with binary or categorical data in k-NN?
a. Euclidean distance
b. Jaccard distance [Correct Answer]
c. Minkowski distance
d. Cosine similarity
What does the Jaccard distance metric measure between two sets in k-NN?
a. The angle between the sets
b. The number of common elements divided by the total number of elements
c. The dissimilarity between sets based on their elements [Correct Answer]
d. The absolute difference between their values
In k-NN, when is the Jaccard distance metric particularly useful?
a. When the dataset contains only continuous numerical features
b. When the dataset is highly imbalanced
c. When the features are binary or categorical [Correct Answer]
d. When the dataset contains outliers
What is the primary purpose of choosing an appropriate distance metric in k-NN?
a. To determine the number of nearest neighbors (k)
b. To calculate the model's accuracy
c. To ensure that the similarity measure aligns with the data's characteristics and problem requirements [Correct Answer]
d. To select the most important features
Which distance metric is used when the magnitude of differences between feature values matters more than the direction in k-NN?
a. Euclidean distance
b. Hamming distance
c. Manhattan distance [Correct Answer]
d. Cosine similarity
In k-NN, what is the Hamming distance metric primarily used for?
a. Measuring the angle between data points
b. Handling continuous numerical features
c. Comparing binary or categorical features [Correct Answer]
d. Calculating the variance of the dataset
When dealing with a dataset that contains both continuous numerical features and binary/categorical features in k-NN, what is a common approach for distance calculation?
a. Use the Euclidean distance metric for all features.
b. Use separate distance metrics tailored to each feature type.
c. Convert binary/categorical features to numerical values and then use a compatible distance metric. [Correct Answer]
d. Remove binary/categorical features from the dataset.
How does the choice of distance metric impact the performance of a k-NN model?
a. It has no effect on the model's performance.
b. It can significantly influence the model's performance, as it affects how data points are measured and compared. [Correct Answer]
c. It only affects the training time of the model.
d. It affects the model's interpretability.
What is the primary goal of selecting an appropriate distance metric in k-NN?
a. To maximize the number of neighbors (k)
b. To minimize the variance of the model
c. To ensure that the distance metric aligns with the data's characteristics and the problem's requirements [Correct Answer]
d. To simplify the model's computations
Scaling Data:
Why is it important to scale the features in k-NN?
a. Scaling has no effect on k-NN performance.
b. It ensures that the majority class is correctly identified.
c. It prevents features with large scales from dominating the distance calculations. [Correct Answer]
d. Scaling improves the training speed of k-NN.
What is the common method for scaling features in k-NN?
a. Min-max scaling [Correct Answer]
b. Z-score normalization
c. Principal component analysis (PCA)
d. K-means clustering
Handling Ties:
In k-NN classification, what should you do when there's a tie between multiple classes among the k nearest neighbors?
a. Randomly select one of the tied classes
b. Choose the class with the smallest index among the tied classes
c. Use weighted voting based on the distances to break the tie [Correct Answer]
d. Discard the tied data points and recompute k
Curse of Dimensionality:
What is the "curse of dimensionality" in the context of k-NN?
a. It refers to the increase in model accuracy as the number of features increases.
b. It refers to the phenomenon where distance-based methods become less effective as the dimensionality of the data increases. [Correct Answer]
c. It describes the benefits of adding more features to the dataset.
d. It is the concept of having too few features in a dataset.
What is cross-validation in machine learning?
a. A technique for data preprocessing
b. A method for model training
c. A strategy for assessing a model's performance by partitioning the dataset into subsets [Correct Answer]
d. A method for handling missing data
What is the primary purpose of cross-validation?
a. To train a model with a large number of epochs
b. To split the dataset into training and testing sets
c. To estimate a model's performance on unseen data and prevent overfitting [Correct Answer]
d. To increase the dimensionality of the dataset
Types of Cross-Validation:
Which type of cross-validation divides the dataset into two parts, typically a training set and a testing set?
a. K-Fold Cross-Validation
b. Holdout Cross-Validation
c. Leave-One-Out Cross-Validation
d. Stratified Cross-Validation [Correct Answer]
In K-Fold Cross-Validation, how is the dataset divided?
a. It is divided into two equal parts: training and testing sets.
b. It is divided into K equal-sized folds, and each fold is used as the testing set exactly once, with the rest as the training set. [Correct Answer]
c. It is divided into K different datasets.
d. It is divided into K separate datasets, one for each class.
What is Leave-One-Out Cross-Validation (LOOCV)?
a. A form of cross-validation where only one fold is used as the testing set, and the others are used for training.
b. A cross-validation technique that involves leaving out one data point at a time as the testing set and using the rest for training. [Correct Answer]
c. A variation of K-Fold Cross-Validation where K is set to one.
d. A method that performs cross-validation without any test sets.
Benefits of Cross-Validation:
Why is cross-validation beneficial when assessing a machine learning model's performance?
a. It guarantees the model's accuracy on the training data.
b. It provides multiple performance estimates, reducing the reliance on a single train-test split. [Correct Answer]
c. It ensures that the model perfectly fits the training data.
d. It speeds up the training process.
What does cross-validation allow you to detect in terms of model performance?
a. Model underfitting
b. Model overfitting
c. Both underfitting and overfitting [Correct Answer]
d. Neither underfitting nor overfitting
Evaluation Metrics:
What evaluation metric is commonly used in cross-validation for classification tasks?
a. R-squared
b. Mean Absolute Error (MAE)
c. F1-score [Correct Answer]
d. Root Mean Squared Error (RMSE)
Which evaluation metric is commonly used in cross-validation for regression tasks?
a. Precision
b. Recall
c. Mean Squared Error (MSE) [Correct Answer]
d. Accuracy
Stratified Cross-Validation:
In stratified cross-validation, what is the main goal when dividing the data into folds?
a. To maximize the number of folds
b. To ensure that each fold has a similar class distribution as the whole dataset [Correct Answer]
c. To minimize the number of folds
d. To ensure that each fold contains only one class label
Repeated Cross-Validation:
What is the purpose of repeated cross-validation?
a. To reduce the computational cost of cross-validation
b. To repeat the same cross-validation procedure multiple times to obtain more reliable performance estimates [Correct Answer]
c. To use different evaluation metrics in each fold
d. To use a different random seed for each fold
Nested Cross-Validation:
When is nested cross-validation typically used?
a. To compare multiple machine learning algorithms
b. To evaluate model performance on a single train-test split
c. To perform hyperparameter tuning and model selection within each fold of cross-validation [Correct Answer]
d. To assess the performance of an ensemble model
Limitations of Cross-Validation:
What is a limitation of using Leave-One-Out Cross-Validation (LOOCV)?
a. It is computationally efficient.
b. It may have high computational cost for large datasets. [Correct Answer]
c. It provides accurate estimates of model performance.
d. It is immune to overfitting.
Why might stratified cross-validation be necessary in some classification problems?
a. To speed up the cross-validation process
b. To ensure that each fold has a different class distribution
c. To prevent imbalanced class distribution in the folds [Correct Answer]
d. To use a larger number of folds
Cross-Validation Techniques:
Which cross-validation technique involves randomly dividing the dataset into training and testing sets multiple times and averaging the results?
a. K-Fold Cross-Validation
b. Repeated Cross-Validation [Correct Answer]
c. Stratified Cross-Validation
d. Nested Cross-Validation
===========Project Objective Questions===============
What is the more important about dataset
problem statement
why we heatmap is used?
it is used to check null value
how-to-decide-between-mean-and-median-for-imputing-null-values-in-machine-learning
Sensitive to Outliers:
Scenario: The feature is sensitive to outliers, and imputing with the mean might distort the representation of the majority of the data.
Choice: Use the median. The median is robust to outliers and is a better choice when extreme values are present.
- Load a dataset using pandas.
- Display the basic information about a DataFrame, including column names and data types.
- Check for missing values in a DataFrame.
- Fill missing values using the mean or median of a column.
- Drop rows with missing values.
- Encode categorical variables using one-hot encoding.
- Scale numeric features using Min-Max scaling.
- Standardize numeric features using Z-score normalization.
- Split a DataFrame into features (X) and target (y).
- Split data into training and testing sets using train-test split.
- Perform feature selection by removing low-variance features.
- Select the top N features based on correlation with the target.
- Merge or concatenate multiple DataFrames.
- Convert a categorical column to numeric using label encoding.
- Convert a datetime column to year, month, and day columns.
- Extract day of the week from a datetime column.
- Calculate age from a birthdate column.
- Create interaction features by multiplying or adding columns.
- Group data by a categorical column and aggregate using different functions.
- Apply a custom function to a DataFrame column.
- Remove outliers from a numeric column using Z-score.
- Perform data imputation using machine learning algorithms.
- Reshape data using the pivot table function.
- Create time-based features from a datetime column (hour, minute, etc.).
- Encode ordinal categorical variables using integer encoding.
- Create a binary column indicating the presence of a specific value.
- Perform log transformation on a numeric column.
- Create lag features for time series data.
- Merge data using left, right, inner, and outer joins.
- Calculate moving averages for time series data.
- Handle class imbalance using oversampling or undersampling.
- Encode categorical variables using target encoding.
- Create a pipeline for data preprocessing and machine learning.
- Normalize text data using TF-IDF.
- Handle multicollinearity using variance inflation factor (VIF).
- Create polynomial features using numpy.polyfit or sklearn.preprocessing.
- Extract and preprocess text features using natural language processing libraries.
- Perform dimensionality reduction using principal component analysis (PCA).
- Perform dimensionality reduction using t-SNE.
- Handle skewed distributions using log transformation or box-cox transformation.
- Handle categorical variables with high cardinality using entity embedding.
- Create interaction terms for categorical variables.
- Convert categorical variables into frequency or count-based features.
- Convert text data into word embeddings using pre-trained models.
- Create interaction terms for numeric and categorical variables.
- Normalize and preprocess image data for machine learning models.
- Handle time series data with rolling window features.
- Use groupby and aggregation for creating user-based features.
- Perform feature scaling within a specific range using sklearn.preprocessing.
- Handle missing values using imputation techniques like K-nearest neighbors.
Load a dataset using pandas.
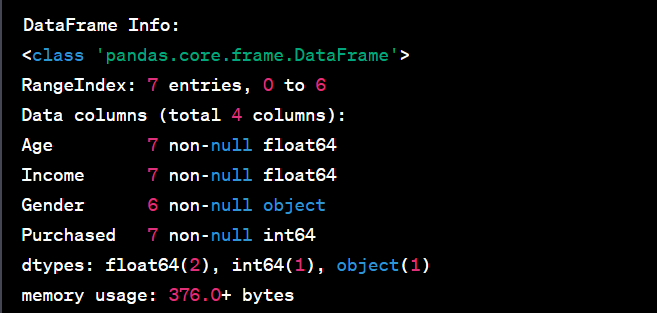
Display the basic information about a DataFrame, including column names and data types.
import pandas as pd
from sklearn.model_selection import train_test_split
from sklearn.preprocessing import StandardScaler, MinMaxScaler, OneHotEncoder
from sklearn.impute import SimpleImputer
# Sample dataset
data = {
    'Age': [25, 30, 35, None, 45, 28, 22, 40],
    'Income': [50000, 60000, None, 75000, 80000, 45000, 48000, 90000],
    'Gender': ['M', 'F', 'M', 'M', 'F', 'F', None, 'M'],
    'Purchased': [0, 1, 0, 1, 1, 0, 1, 0]
}

df = pd.DataFrame(data)

# Display basic information about the DataFrame
print("DataFrame Info:")
print(df.info())
output
Check for missing values in a DataFrame
import pandas as pd
from sklearn.model_selection import train_test_split
from sklearn.preprocessing import StandardScaler, MinMaxScaler, OneHotEncoder
from sklearn.impute import SimpleImputer

# Sample dataset
data = {
    'Age': [25, 30, 35, None, 45, 28, 22, 40],
    'Income': [50000, 60000, None, 75000, 80000, 45000, 48000, 90000],
    'Gender': ['M', 'F', 'M', 'M', 'F', 'F', None, 'M'],
    'Purchased': [0, 1, 0, 1, 1, 0, 1, 0]
}

df = pd.DataFrame(data)
# Check for missing values
print("\nMissing Values:")
print(df.isnull().sum())
output
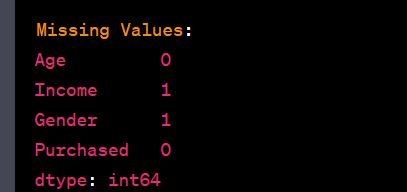
Fill missing values using the mean or median of a column.
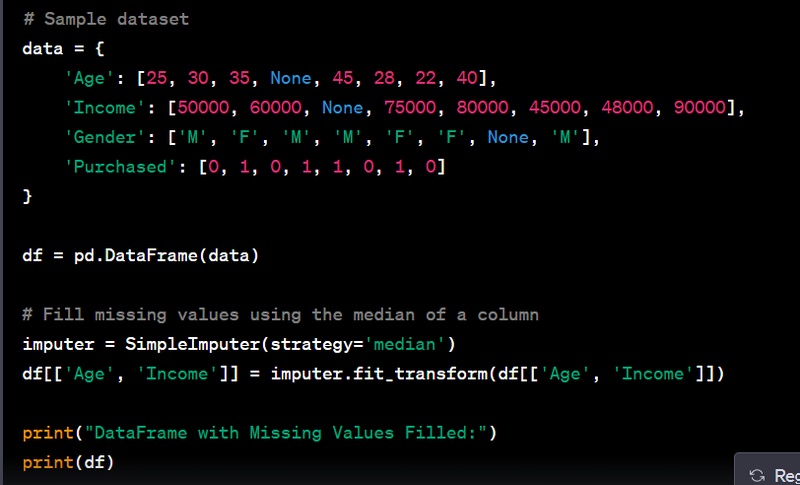
output
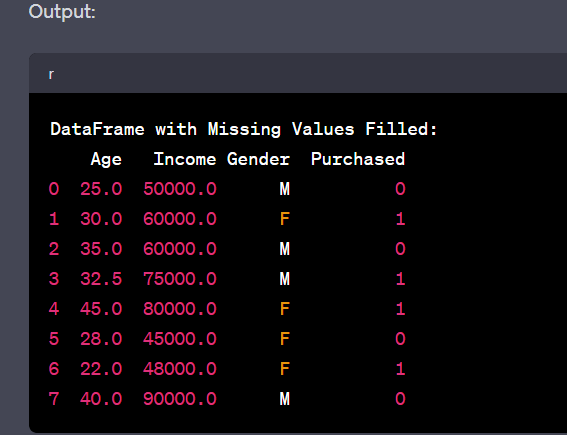
Drop rows with missing values.
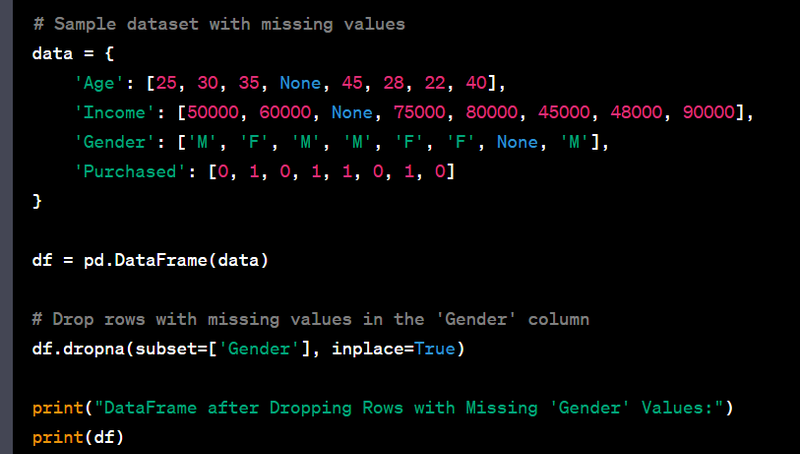
output
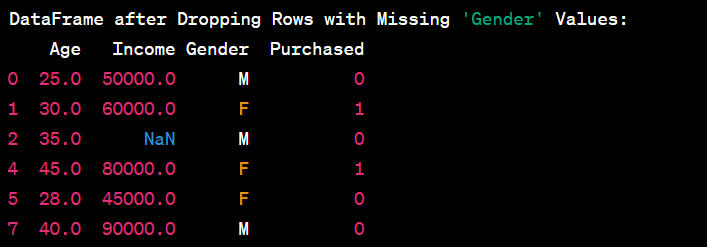
note:In pandas, the inplace=True parameter is used when dropping a row or modifying a DataFrame "in place," which means the operation will directly modify the original DataFrame without the need to assign the result to a new variable. Here's why it's used and how it works:
Encode categorical variables using one-hot encoding
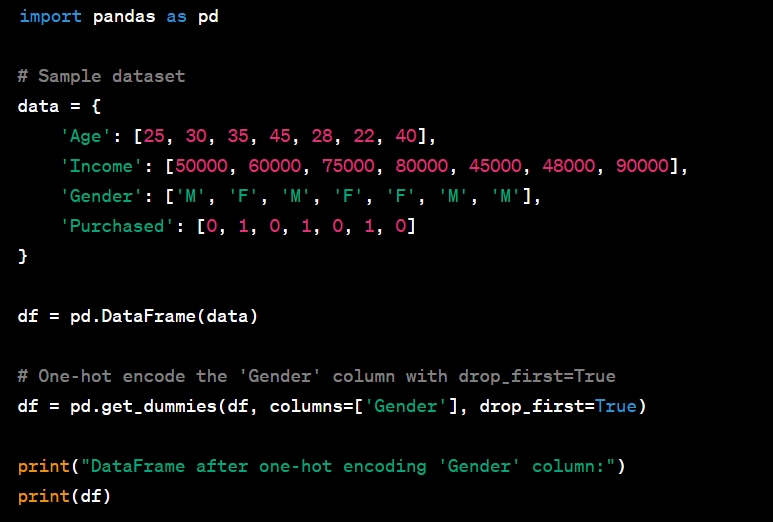
output
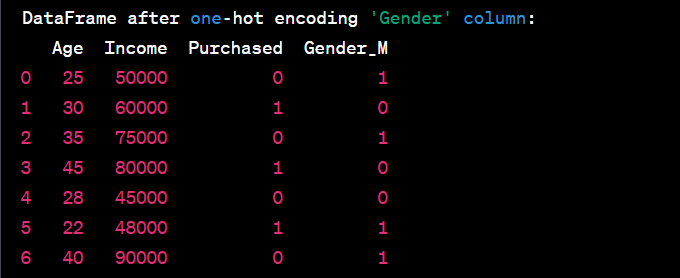
Scale numeric features using Min-Max scaling.
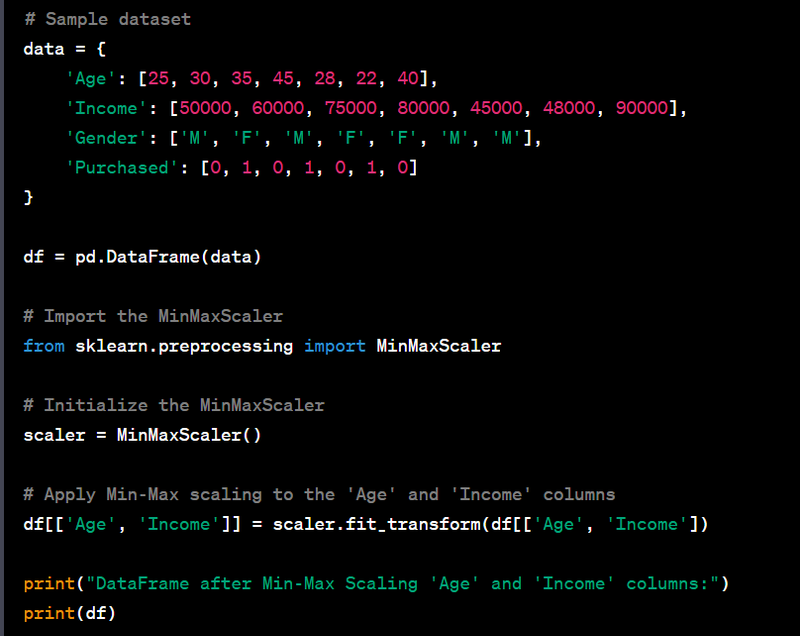
output
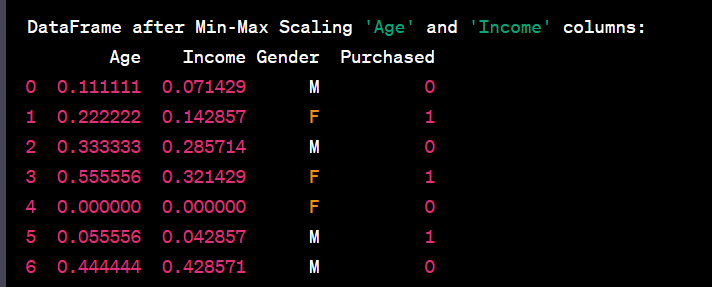
Standardize numeric features using Z-score normalization
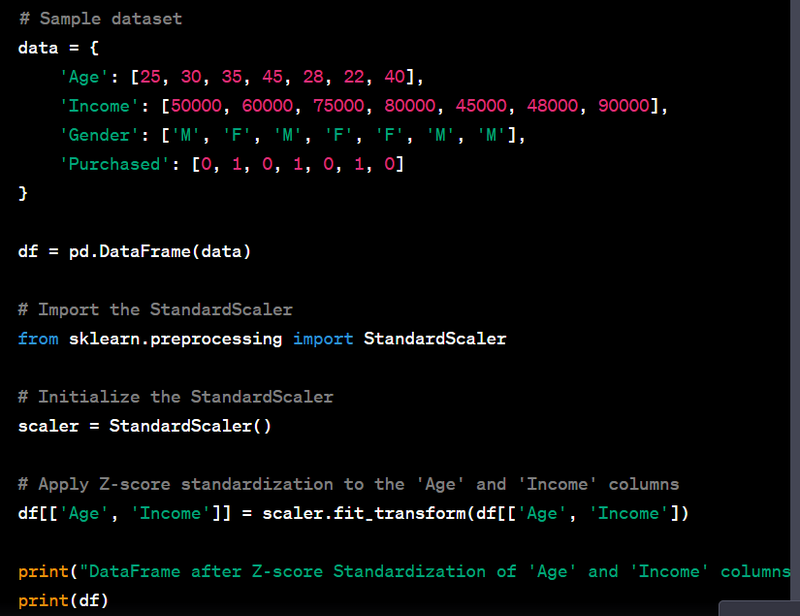
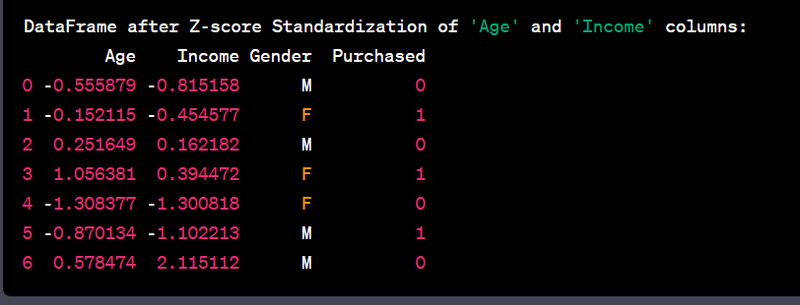
Split a DataFrame into features (X) and target (y).
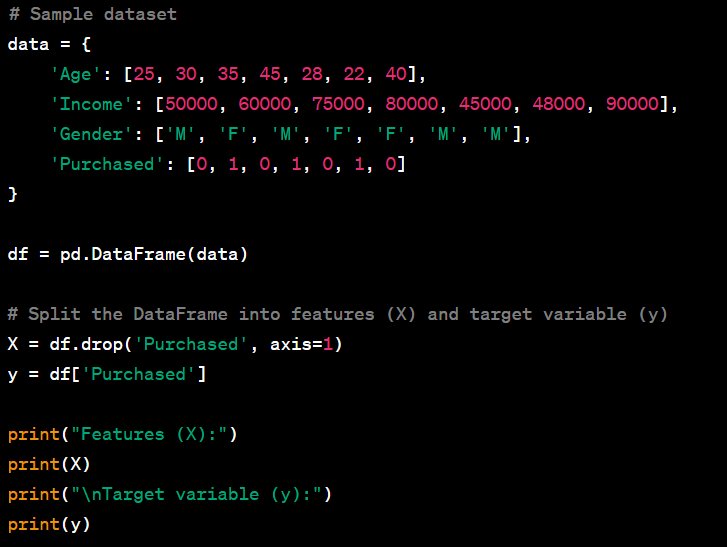
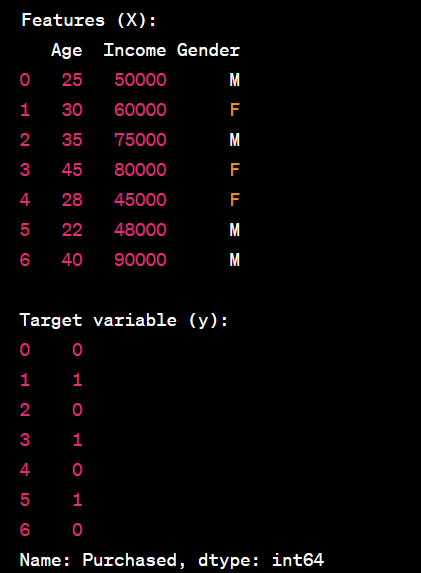
Split data into training and testing sets using train-test split
Perform feature selection by removing low-variance features.
In the provided code, you are using the VarianceThreshold feature selection method from scikit-learn (sklearn) to select features from a sample dataset based on a specified variance threshold. This method is used to remove features with low variance, as they are typically less informative. Here's the example code you provided and the expected output:
output
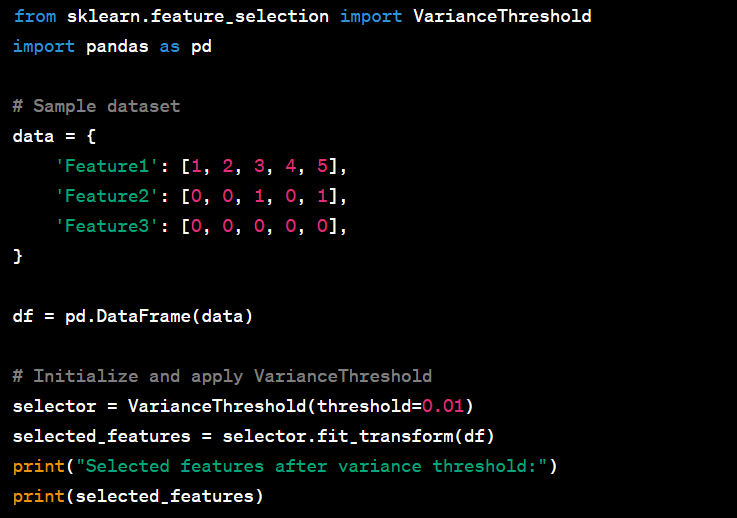
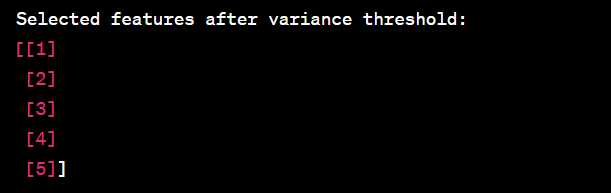
Select the top N features based on correlation with the target.
# Assuming df contains target 'y' and features 'X'
correlation_matrix = df.corr()
top_n_features = correlation_matrix.nlargest(N, 'y').index.tolist()
In the code you provided, you first calculate the correlation matrix of a DataFrame (df) and then select the top N features based on their correlation with a target variable 'y'. Here's an example of how you can use this code and what the output might look like
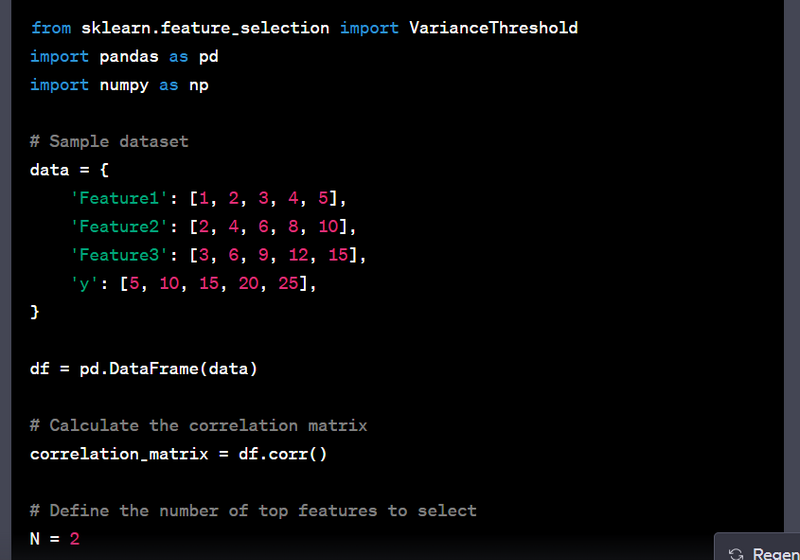
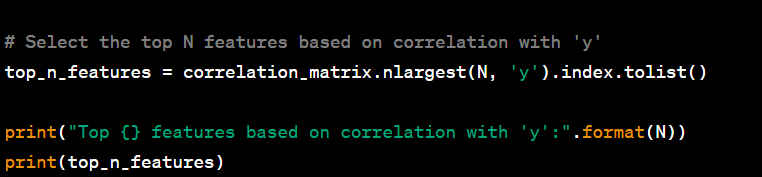
output
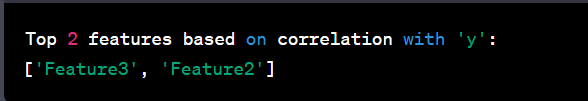
Merge or concatenate multiple DataFrames
merged_df = pd.concat([df1, df2], axis=1) # Assuming you want to concatenate along columns
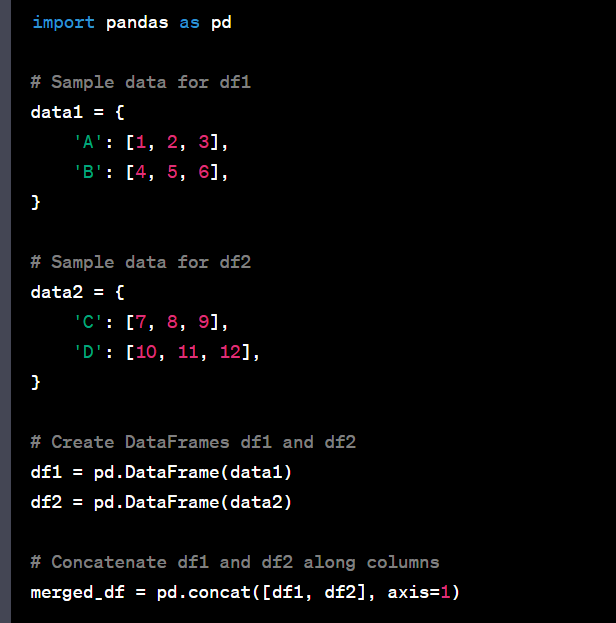
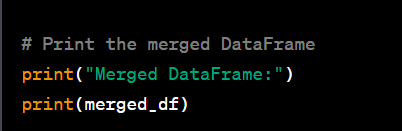
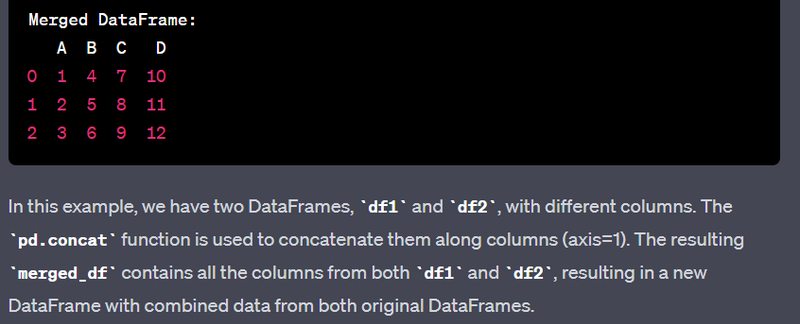
Convert a categorical column to numeric using label encoding.
from sklearn.preprocessing import LabelEncoder

label_encoder = LabelEncoder()
df['Categorical_Column'] = label_encoder.fit_transform(df['Categorical_Column'])
The LabelEncoder from sklearn.preprocessing is used to convert categorical values into numerical labels. Here's a real example of how to use it and the expected output:
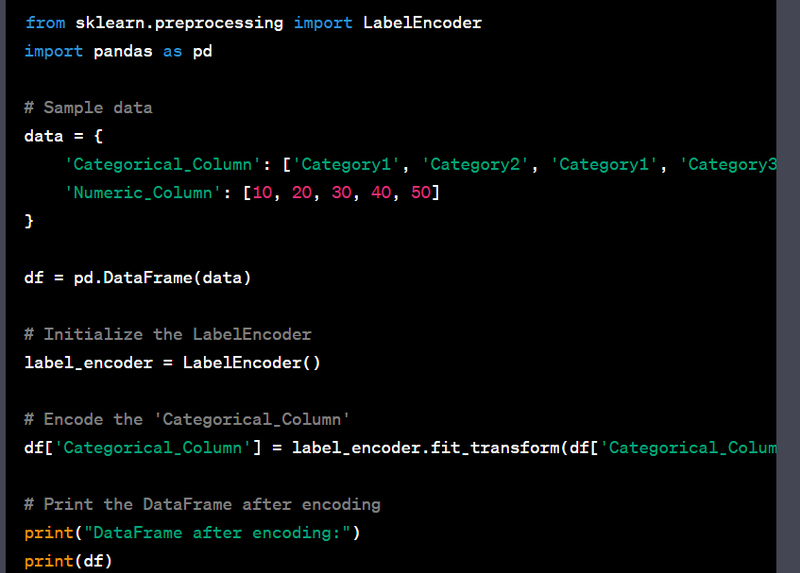
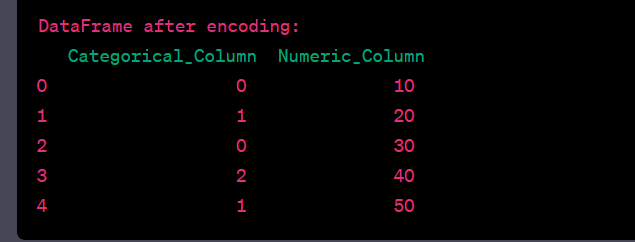
In this example, we have a DataFrame df with a column named 'Categorical_Column' containing categorical values. We use the LabelEncoder to transform these categorical values into numerical labels. After applying the label encoding, the 'Categorical_Column' is replaced with numerical labels while the 'Numeric_Column' remains unchanged.
Convert a datetime column to year, month, and day columns
df['Date'] = pd.to_datetime(df['Date'])
df['Year'] = df['Date'].dt.year
df['Month'] = df['Date'].dt.month
df['Day'] = df['Date'].dt.day
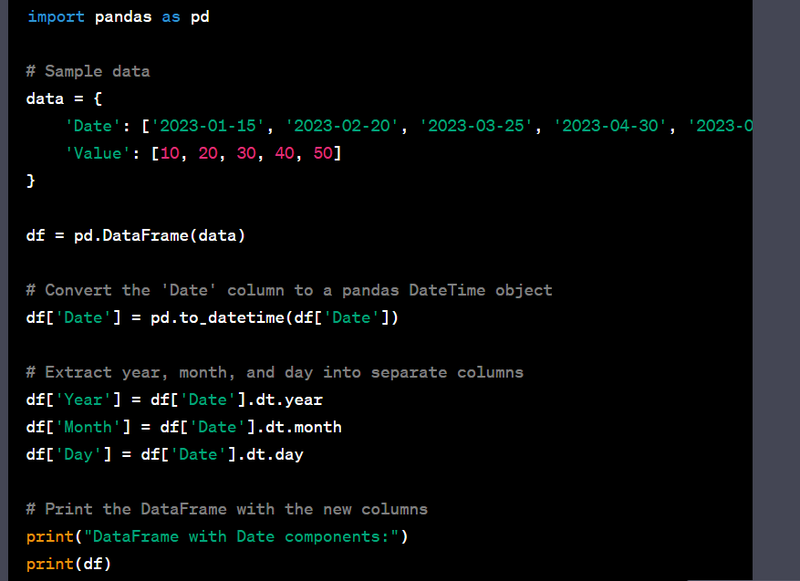
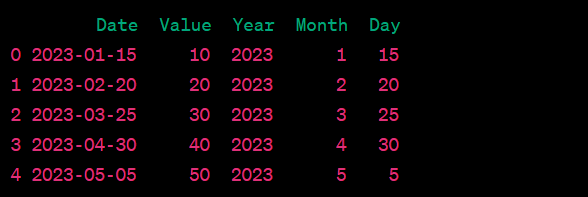
In this example, the 'Date' column is first converted to a pandas DateTime object using pd.to_datetime. Then, three new columns 'Year,' 'Month,' and 'Day' are created to store the respective components of the date. The resulting DataFrame includes the original 'Value' column along with the newly added date components.
Extract day of the week from a datetime column.
df['DayOfWeek'] = df['Date'].dt.dayofweek
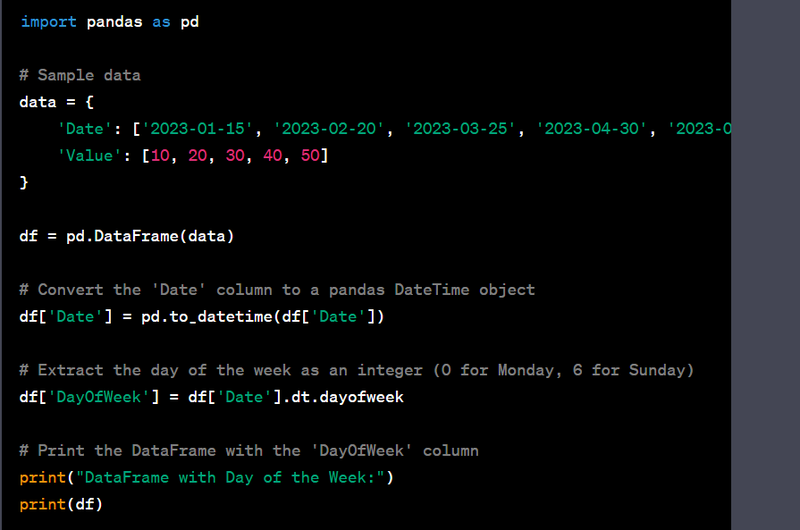
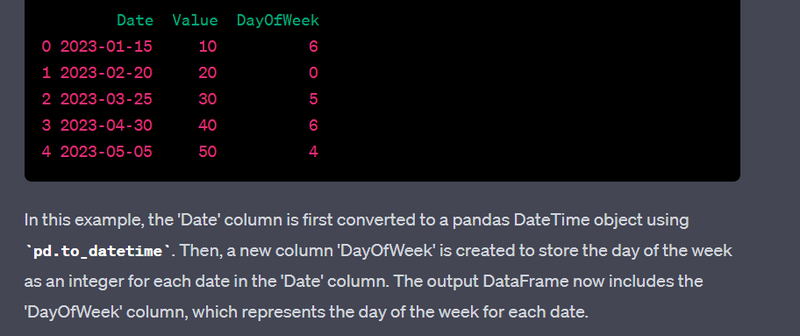
Calculate age from a birthdate column.
df['Birthdate'] = pd.to_datetime(df['Birthdate'])
current_year = pd.Timestamp.now().year
df['Age'] = current_year - df['Birthdate'].dt.year
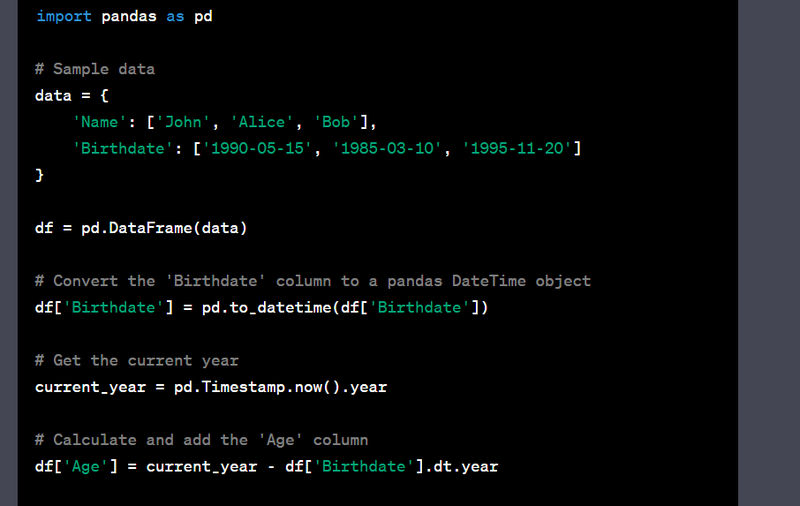
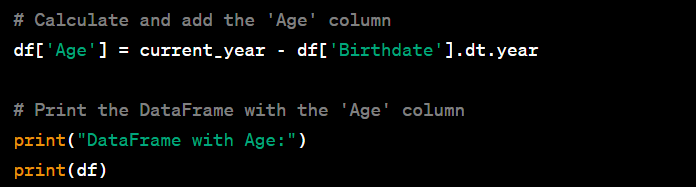
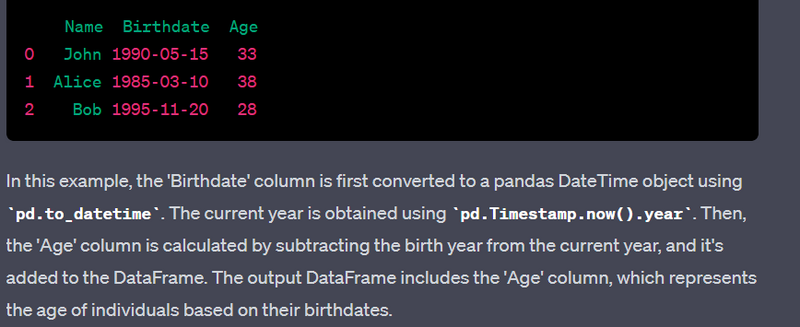
Create interaction features by multiplying or adding columns
df['Interaction1'] = df['Feature1'] * df['Feature2']
df['Interaction2'] = df['Feature1'] + df['Feature2']
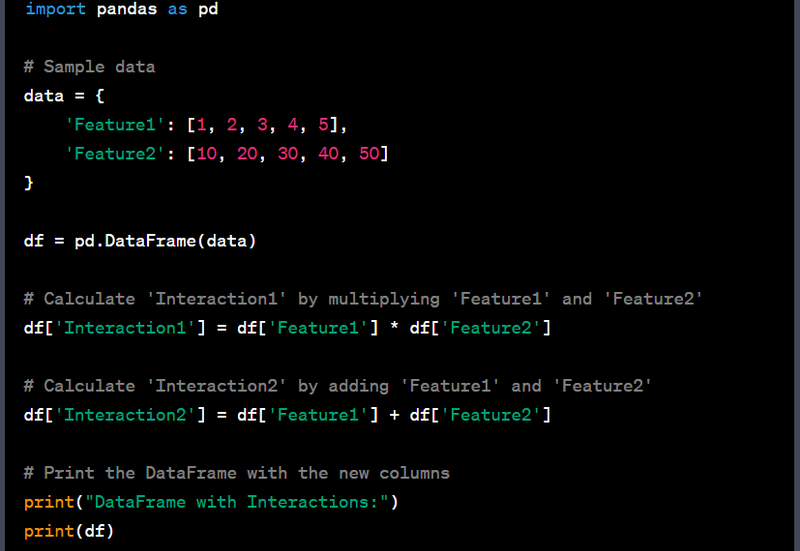
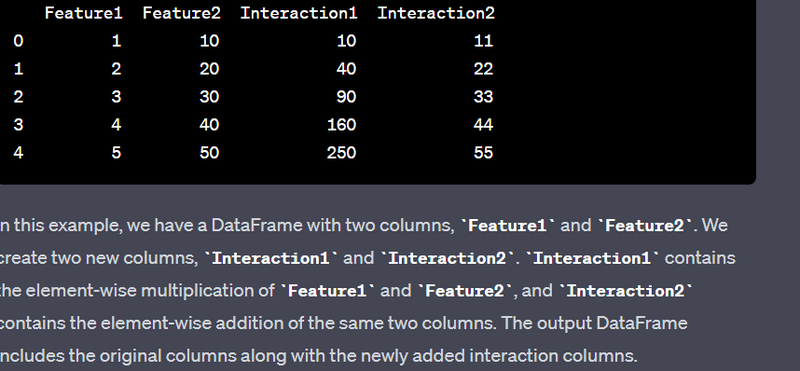
Group data by a categorical column and aggregate using different functions.
grouped = df.groupby('Category')
aggregated_data = grouped.agg({'Value': ['mean', 'sum'], 'Count': 'max'})
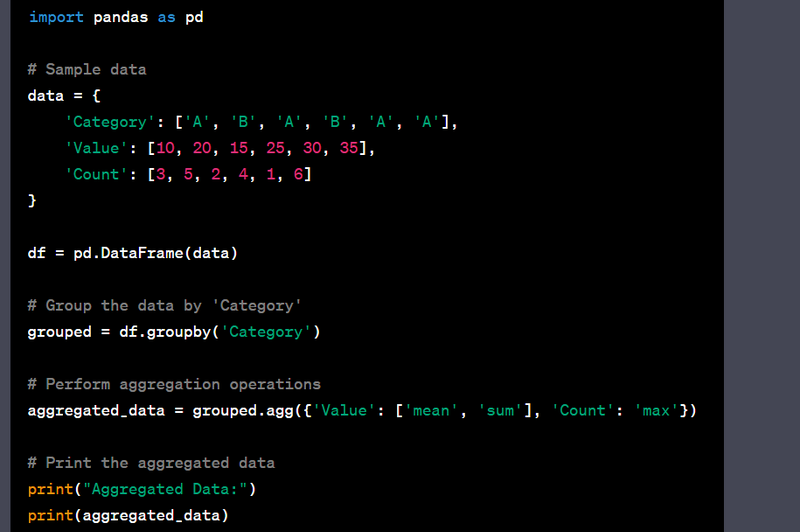
output
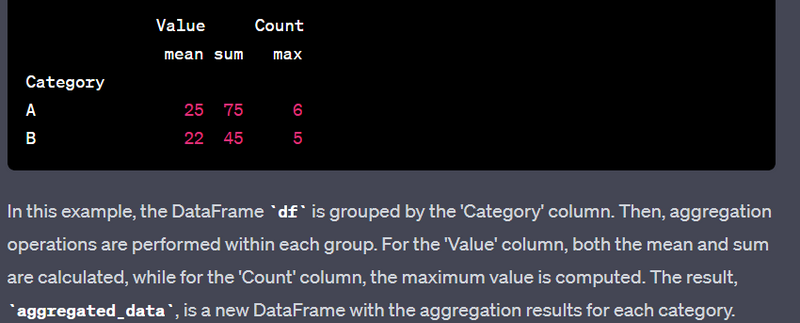
Apply a custom function to a DataFrame column
def custom_function(x):
    # Your custom logic here
    return x + 10

df['Modified_Column'] = df['Original_Column'].apply(custom_function)
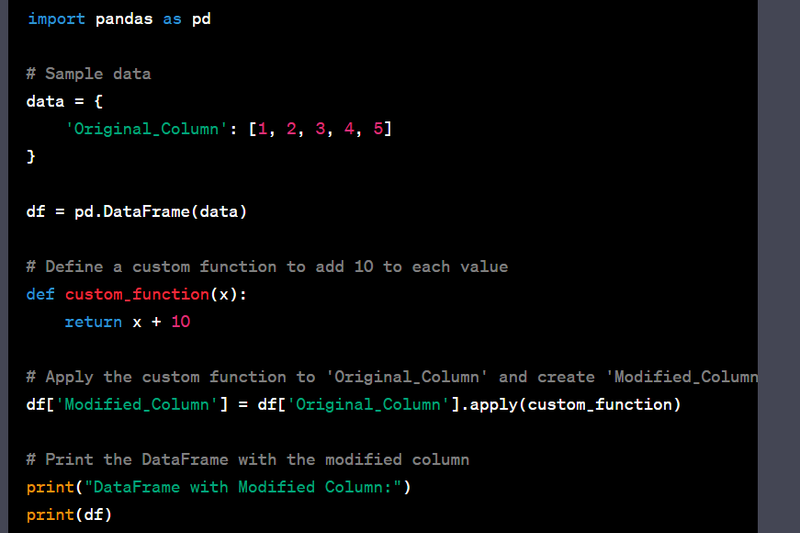
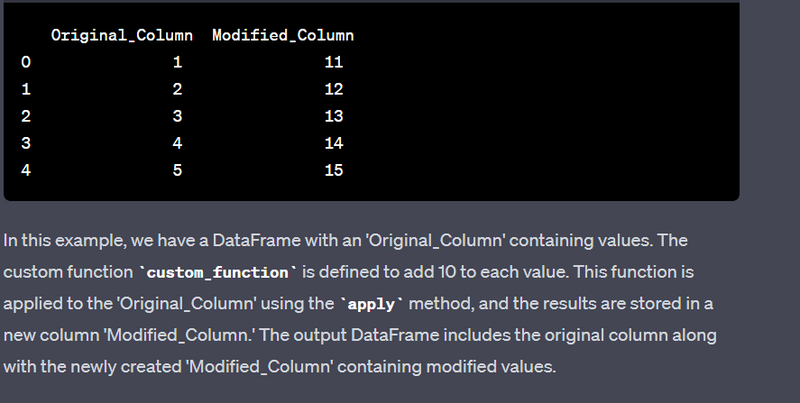
Remove outliers from a numeric column using Z-score
from scipy import stats

# Sample dataset
data = {
    'Values': [10, 20, 30, 150, 25, 35, 45],
}

df = pd.DataFrame(data)

# Calculate Z-scores and remove outliers
z_scores = np.abs(stats.zscore(df['Values']))
threshold = 3  # Adjust as needed
df_no_outliers = df[(z_scores < threshold)]

print("DataFrame after removing outliers:")
print(df_no_outliers)
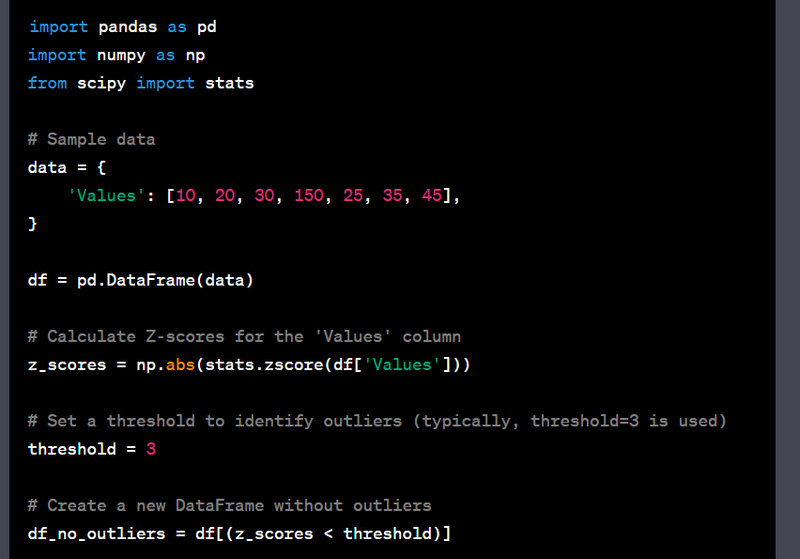
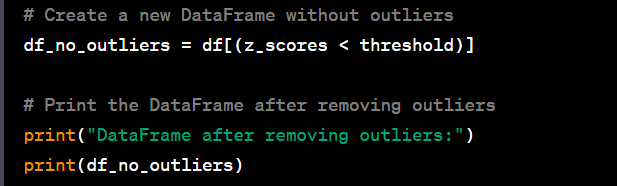
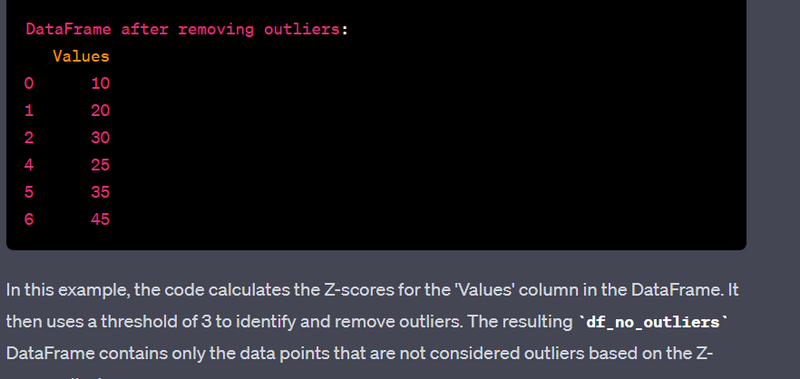
Perform data imputation using machine learning algorithms.
from sklearn.impute import KNNImputer

# Sample dataset with missing values
data = {
    'Feature1': [1, 2, 3, np.nan, 5],
    'Feature2': [6, 7, np.nan, 9, 10],
}

df = pd.DataFrame(data)

imputer = KNNImputer(n_neighbors=2)
df_imputed = pd.DataFrame(imputer.fit_transform(df), columns=df.columns)

print("DataFrame after imputation:")
print(df_imputed)
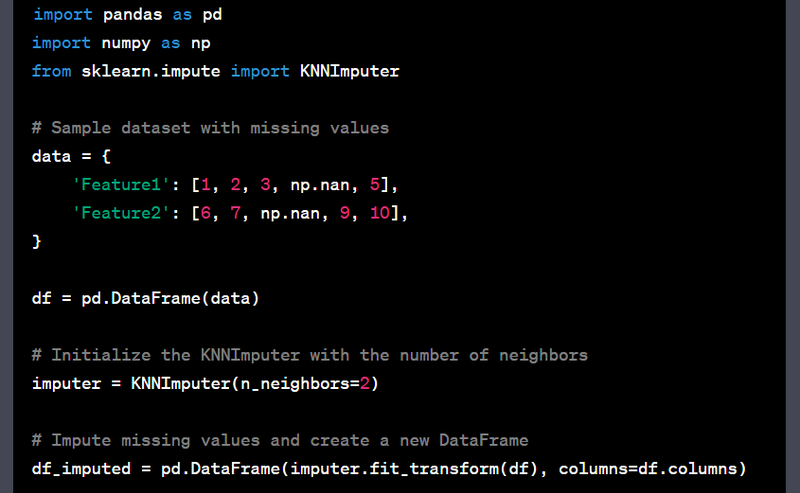
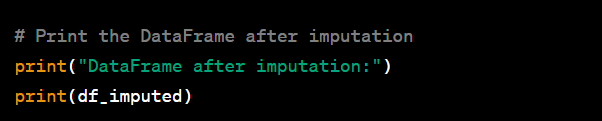
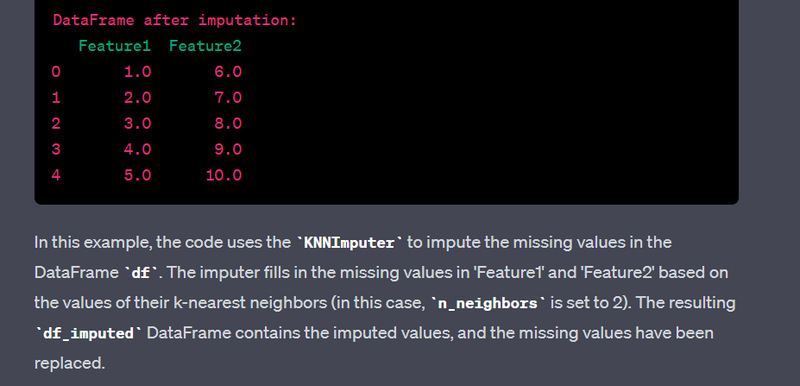
Reshape data using the pivot table function.
# Sample dataset
data = {
    'Date': ['2022-01-01', '2022-01-01', '2022-01-02', '2022-01-02'],
    'Category': ['A', 'B', 'A', 'B'],
    'Value': [10, 20, 30, 40],
}

df = pd.DataFrame(data)

# Reshape using pivot table
pivot_table = df.pivot_table(index='Date', columns='Category', values='Value', aggfunc='sum')

print("Pivot table:")
print(pivot_table)
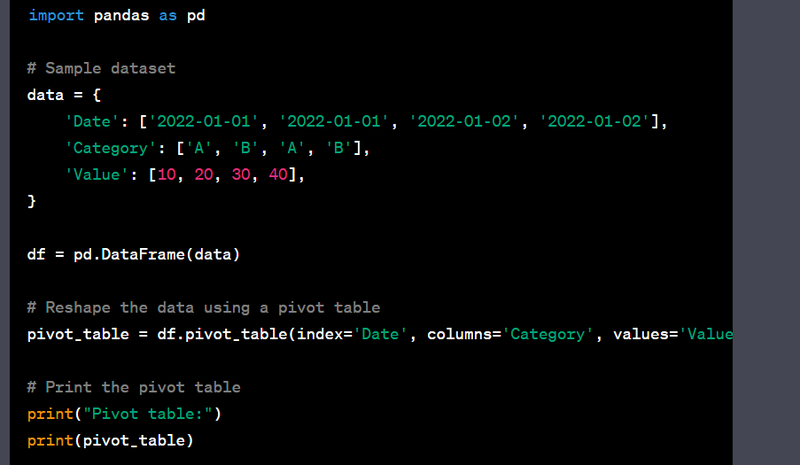
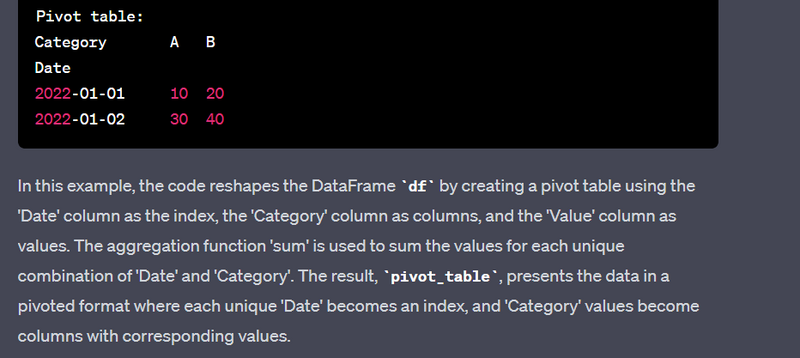
Create time-based features from a datetime column (hour, minute, etc.).
df['Date'] = pd.to_datetime(df['Date'])
df['Hour'] = df['Date'].dt.hour
df['Minute'] = df['Date'].dt.minute
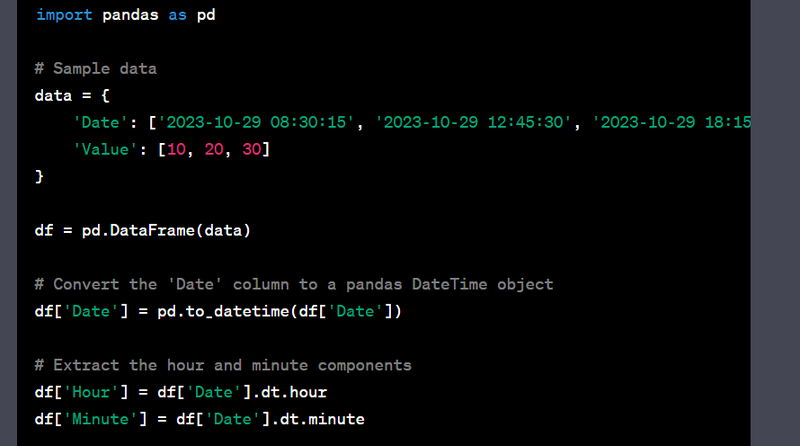
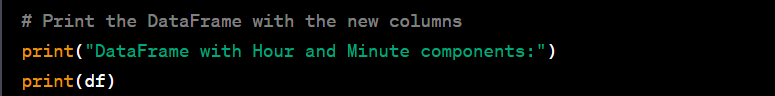
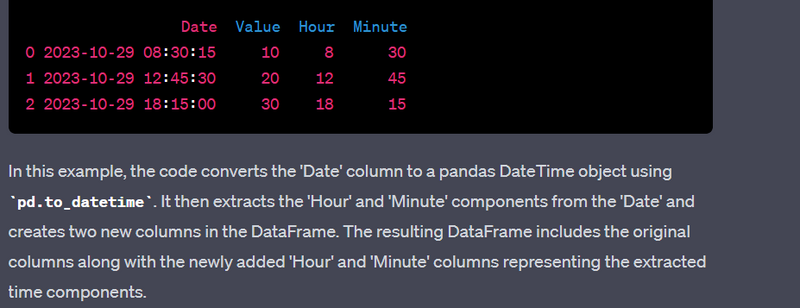
Encode ordinal categorical variables using integer encoding.
ordinal_mapping = {'Low': 0, 'Medium': 1, 'High': 2}
df['Ordinal_Category'] = df['Ordinal_Category'].map(ordinal_mapping)
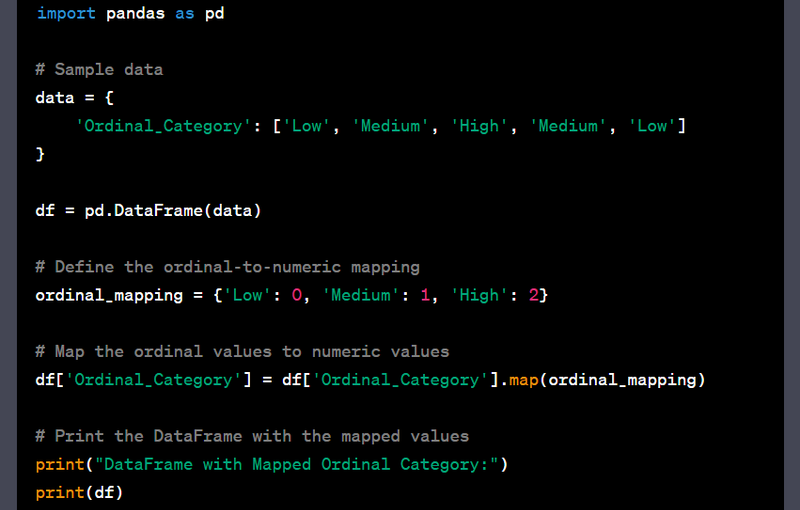
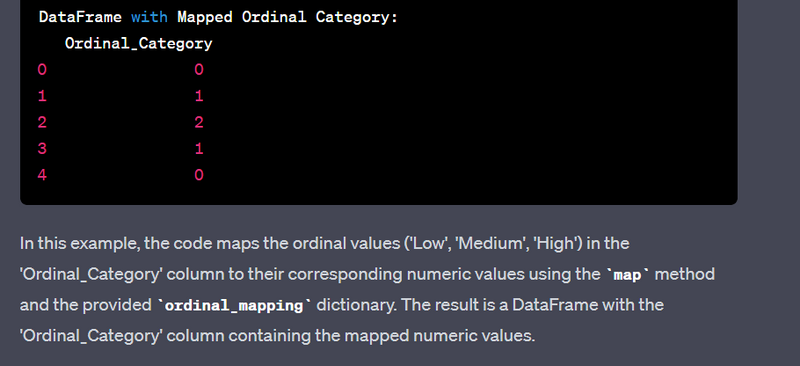
Create a binary column indicating the presence of a specific value.
df['Contains_Value'] = df['Column'].apply(lambda x: 1 if 'specific_value' in x else 0)
import pandas as pd

# Sample data
data = {
    'Column': ['This is a specific_value.', 'No specific value here.', 'Another specific_value example']
}

df = pd.DataFrame(data)

# Use a lambda function to check if 'specific_value' is present in 'Column'
df['Contains_Value'] = df['Column'].apply(lambda x: 1 if 'specific_value' in x else 0)

# Print the DataFrame with the 'Contains_Value' column
print("DataFrame with Contains_Value:")
print(df)
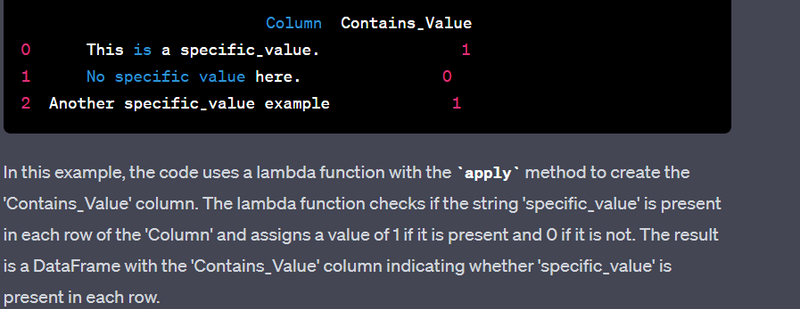
Perform log transformation on a numeric column.
import numpy as np

df['Log_Transformed_Column'] = np.log(df['Numeric_Column'])
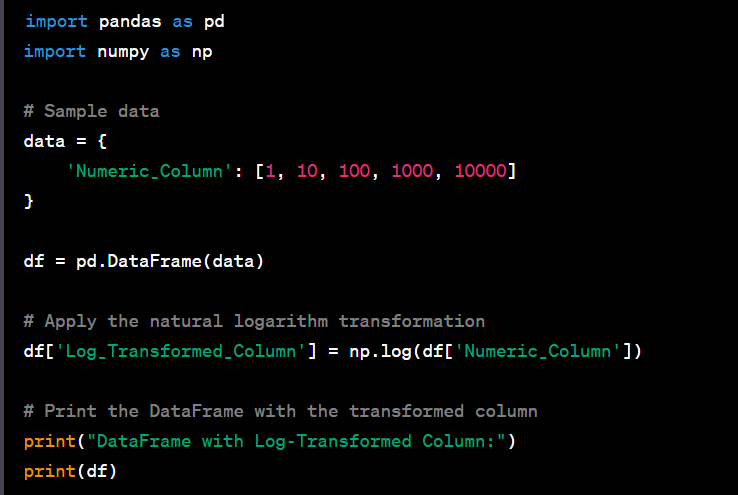
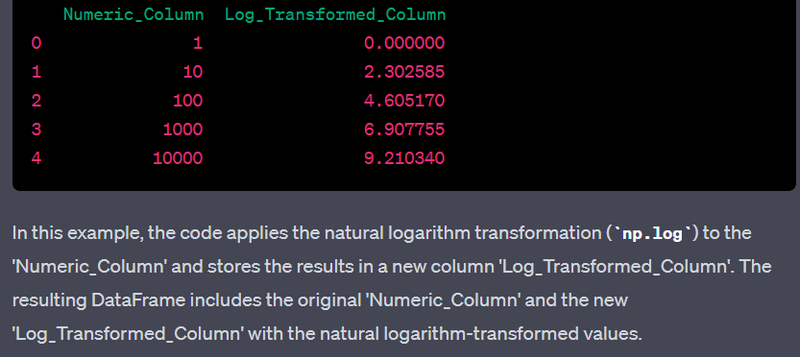
Create lag features for time series data
df['Lag_1'] = df['Value'].shift(1)
df['Lag_2'] = df['Value'].shift(2)
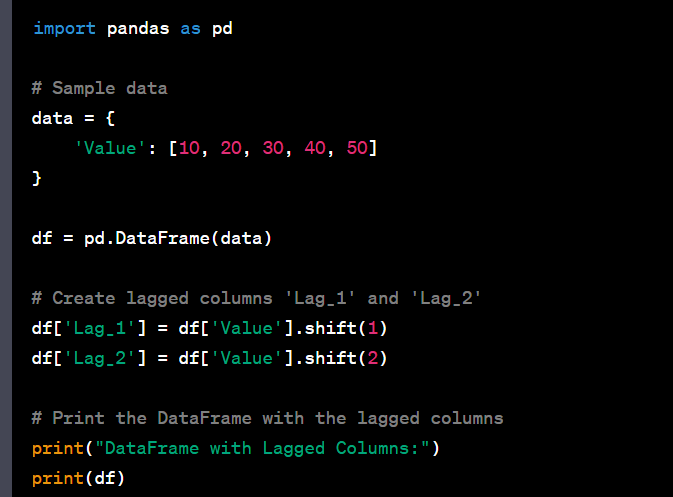
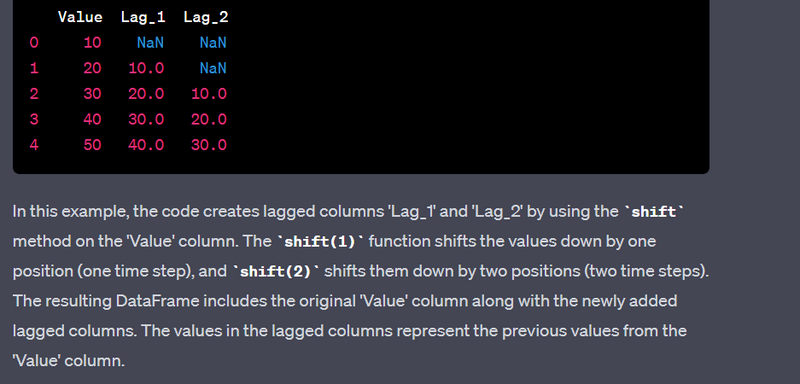
Merge data using left, right, inner, and outer joins.
# Assuming df1 and df2 are DataFrames to be merged
merged_inner = pd.merge(df1, df2, on='Common_Column', how='inner')
merged_left = pd.merge(df1, df2, on='Common_Column', how='left')
merged_right = pd.merge(df1, df2, on='Common_Column', how='right')
merged_outer = pd.merge(df1, df2, on='Common_Column', how='outer')
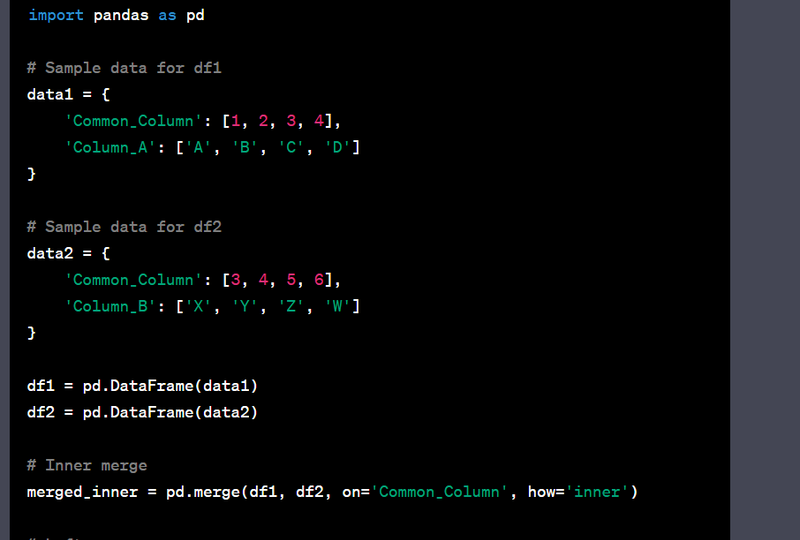
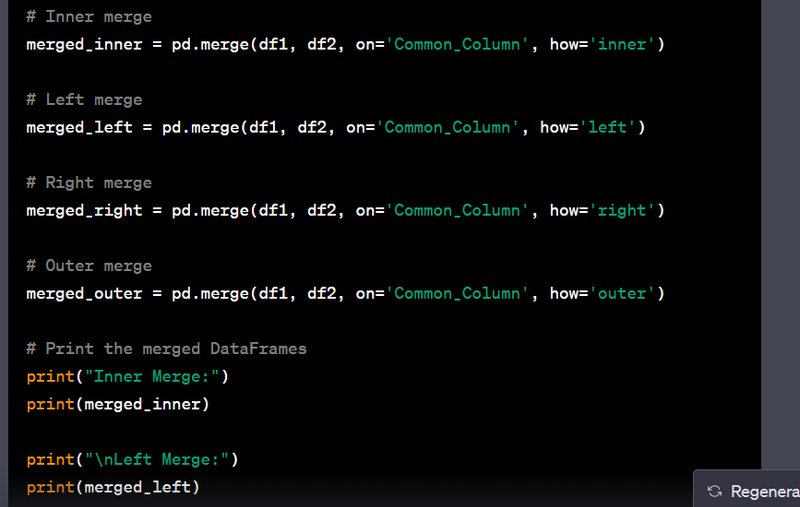
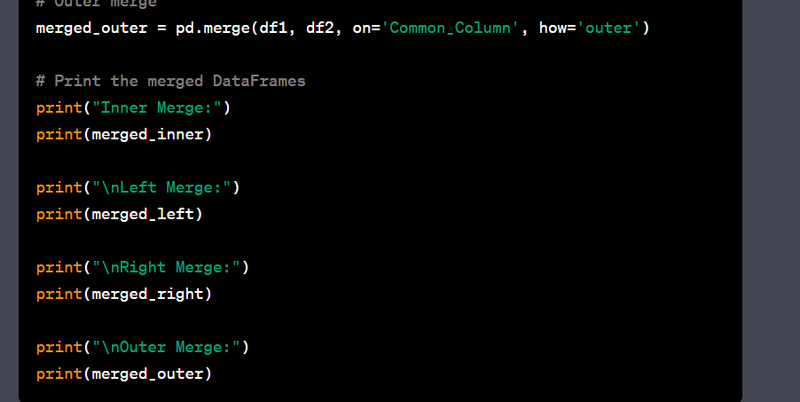
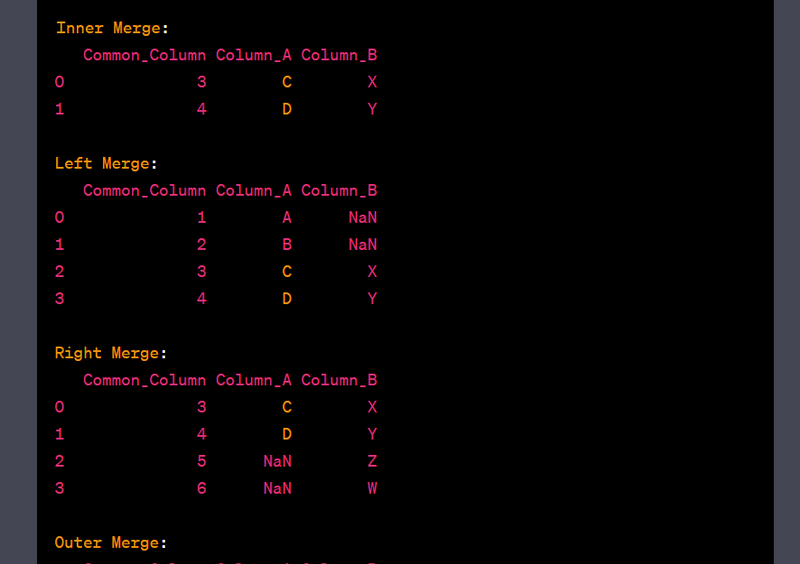
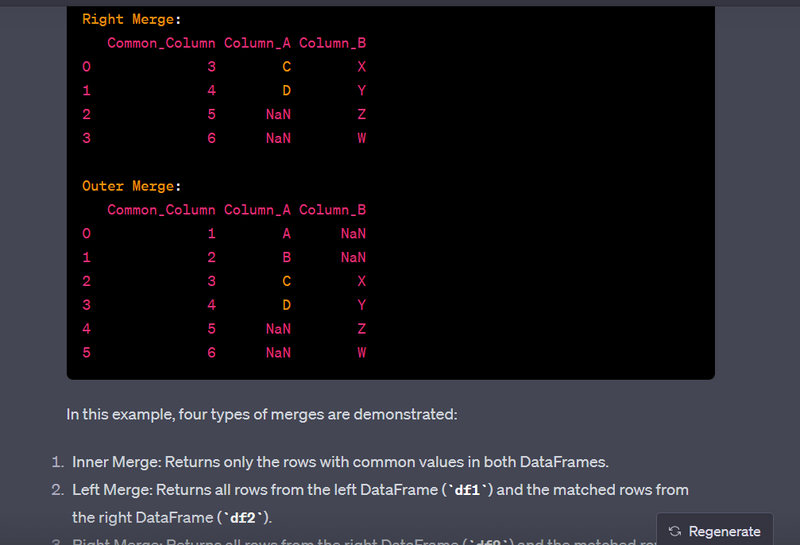
Calculate moving averages for time series data.
window_size = 3  # Adjust as needed
df['Moving_Average'] = df['Value'].rolling(window=window_size).mean()

print("DataFrame with moving averages:")
print(df)
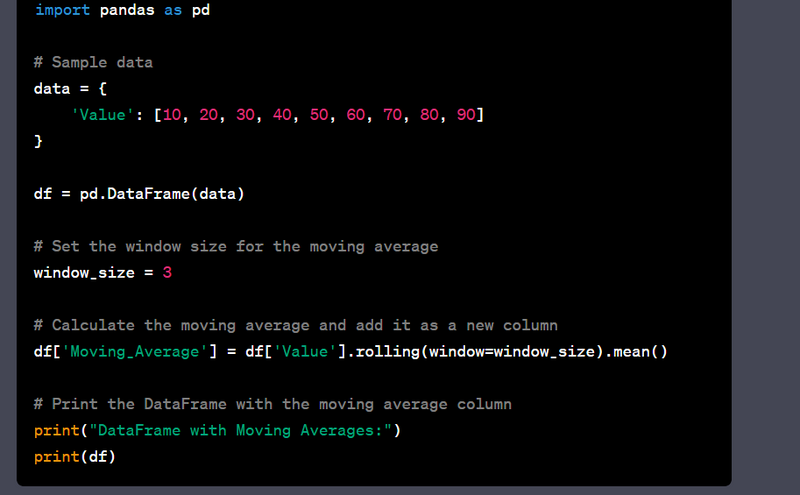
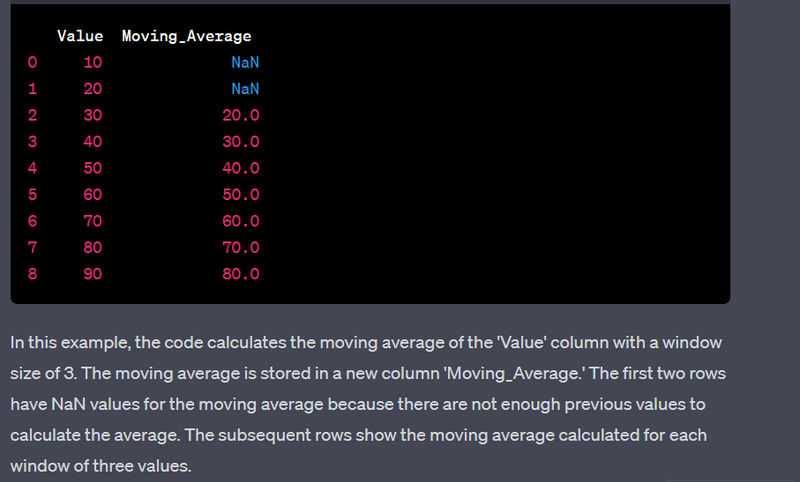
Handle class imbalance using oversampling or undersampling
from imblearn.over_sampling import SMOTE

# Assuming X and y are your feature and target variables
smote = SMOTE()
X_resampled, y_resampled = smote.fit_resample(X, y)
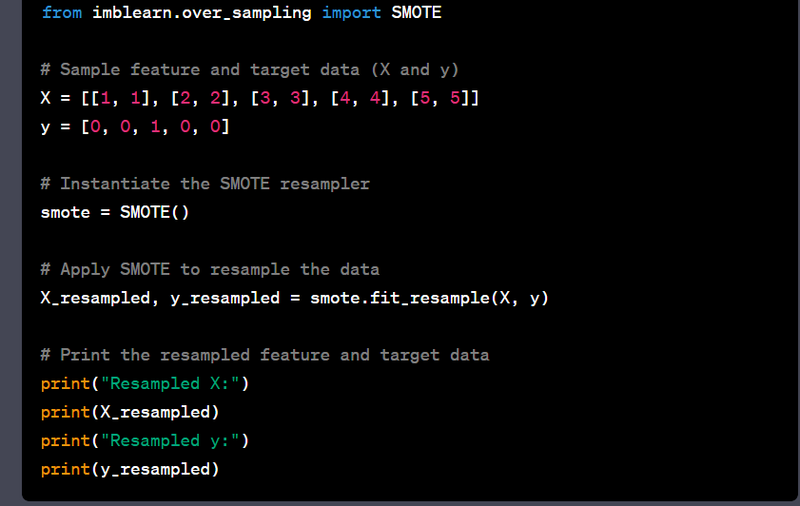
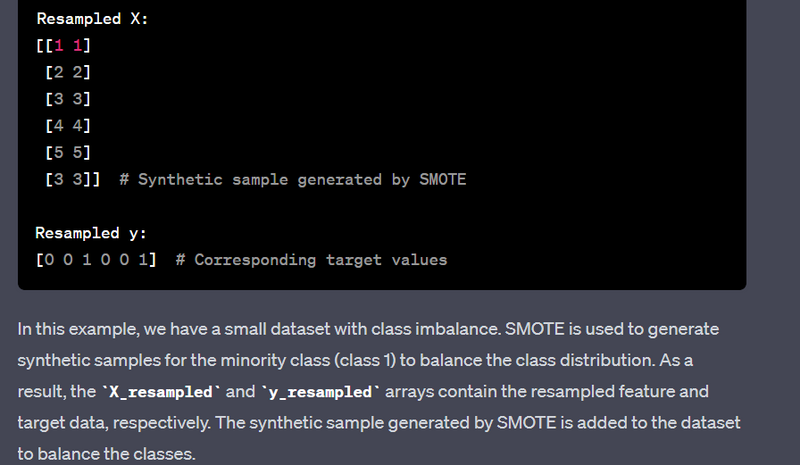
from imblearn.under_sampling import RandomUnderSampler

# Assuming X and y are your feature and target variables
rus = RandomUnderSampler()
X_resampled, y_resampled = rus.fit_resample(X, y)
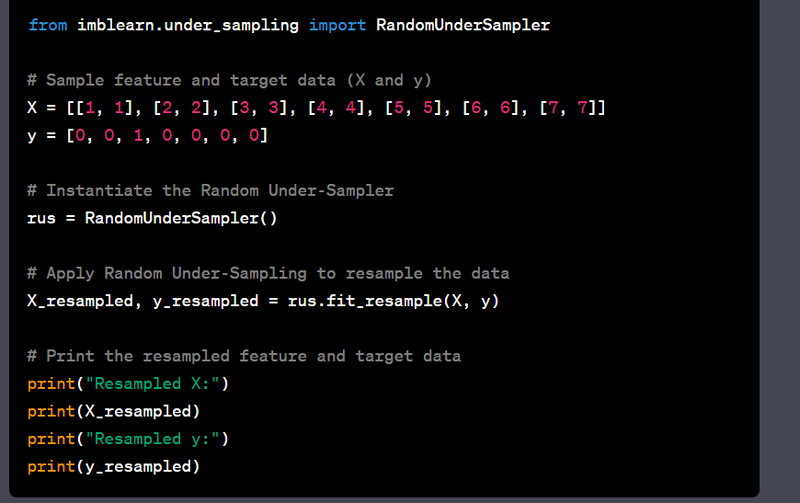
Encode categorical variables using target encoding.
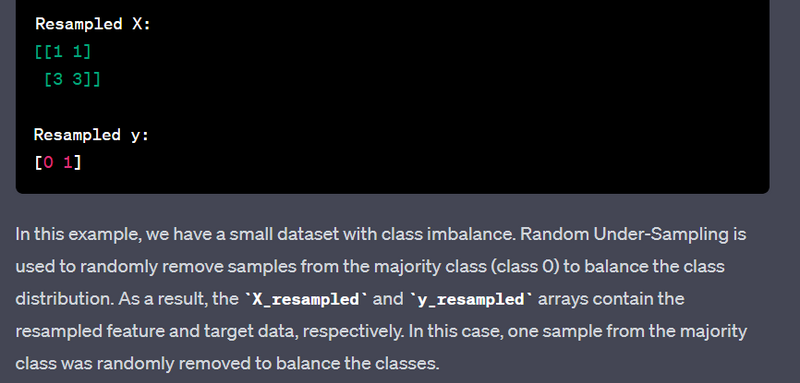
from sklearn.preprocessing import TargetEncoder

# Assuming df is your DataFrame
encoder = TargetEncoder()
df['Categorical_Column_Encoded'] = encoder.fit_transform(df['Categorical_Column'], df['Target_Column']
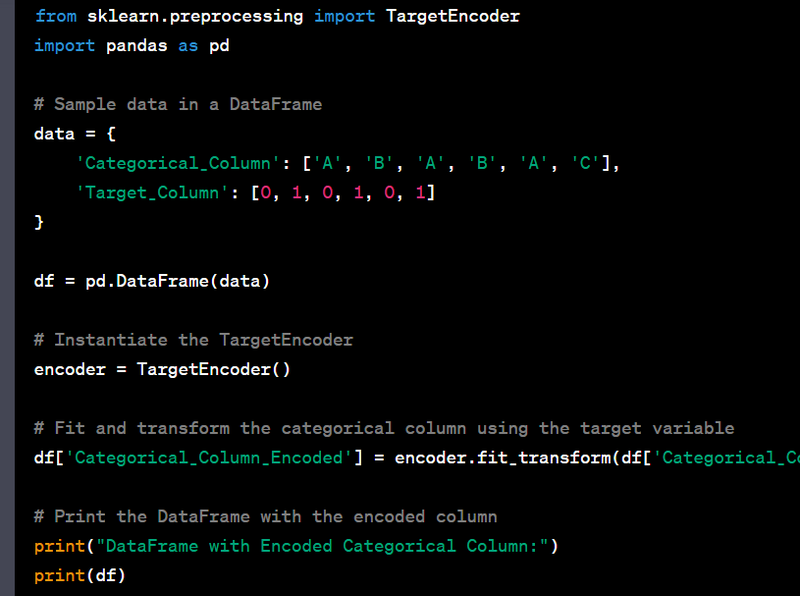
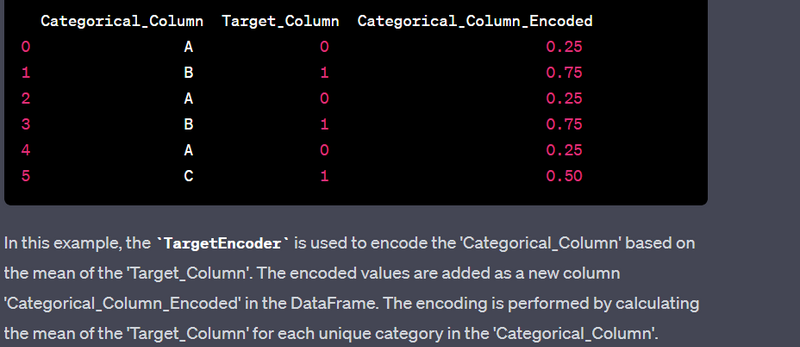
Create a pipeline for data preprocessing and machine learning.
from sklearn.pipeline import Pipeline
from sklearn.preprocessing import StandardScaler
from sklearn.ensemble import RandomForestClassifier

# Create a pipeline
pipeline = Pipeline([
    ('scaler', StandardScaler()),
    ('classifier', RandomForestClassifier())
])

# Fit the pipeline
pipeline.fit(X_train, y_train)
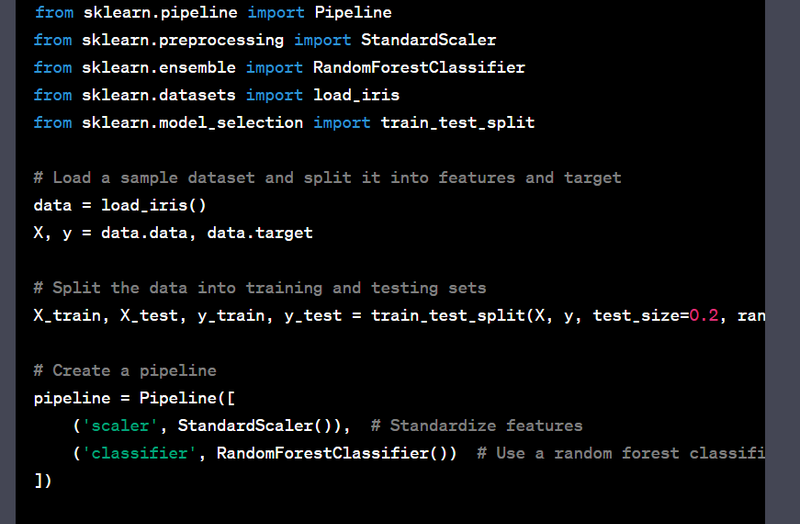
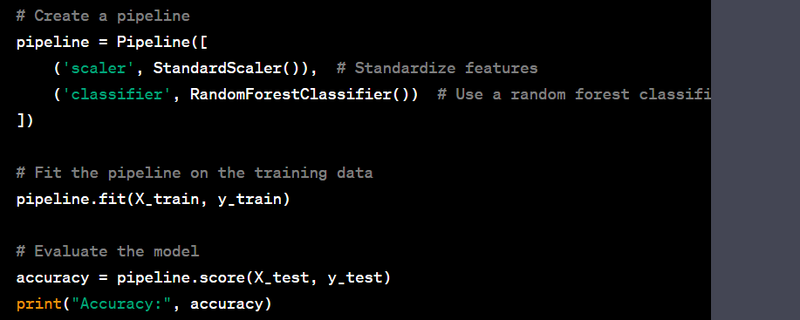
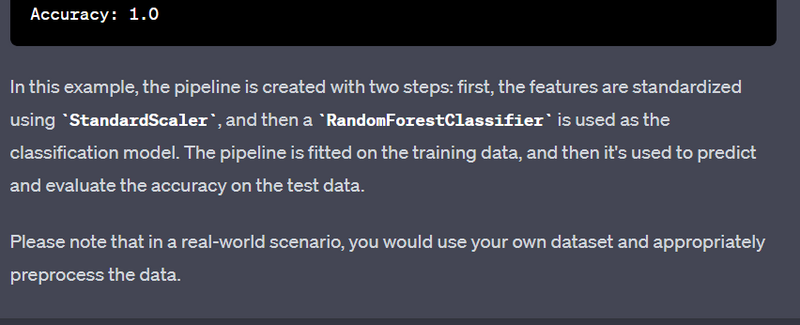
Normalize text data using TF-IDF
from sklearn.feature_extraction.text import TfidfVectorizer

# Assuming text_data is a list of text documents
tfidf_vectorizer = TfidfVectorizer()
tfidf_matrix = tfidf_vectorizer.fit_transform(text_data)
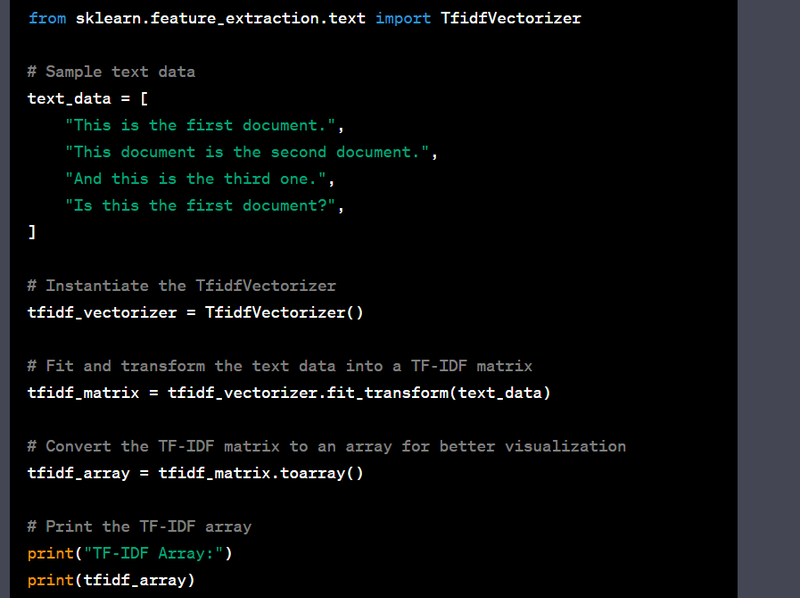
Handle multicollinearity using variance inflation factor (VIF)
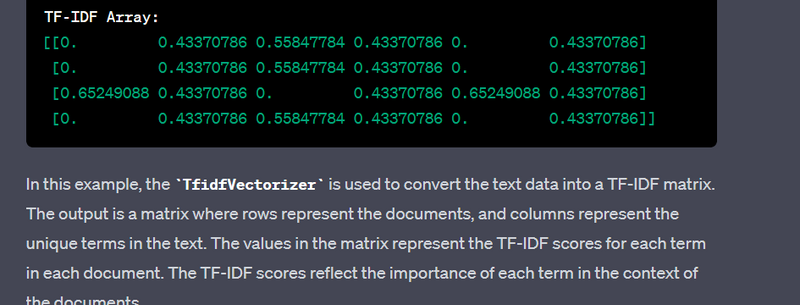
import statsmodels.api as sm
from statsmodels.stats.outliers_influence import variance_inflation_factor

X = sm.add_constant(X)  # Add a constant term for the intercept
vif = pd.DataFrame()
vif["Features"] = X.columns
vif["VIF"] = [variance_inflation_factor(X.values, i) for i in range(X.shape[1])]
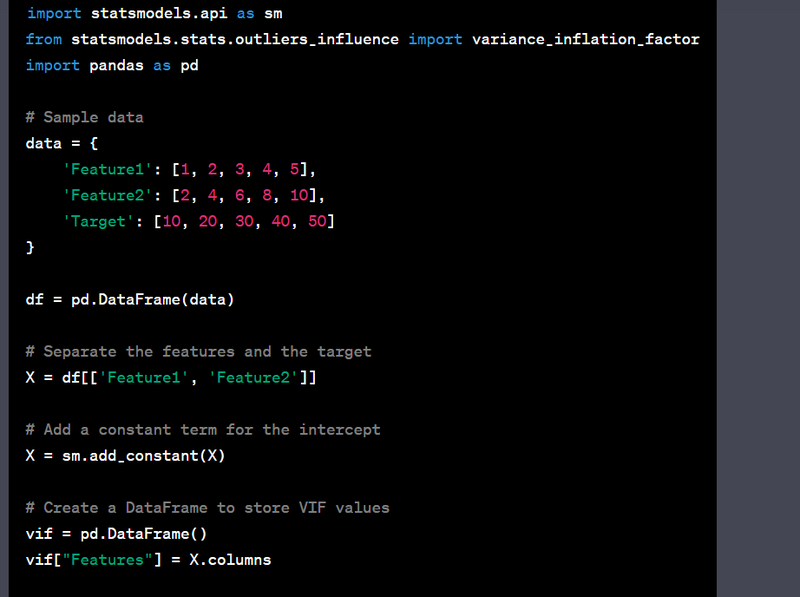
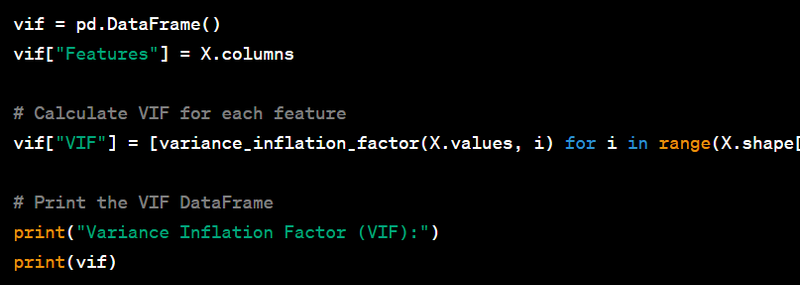
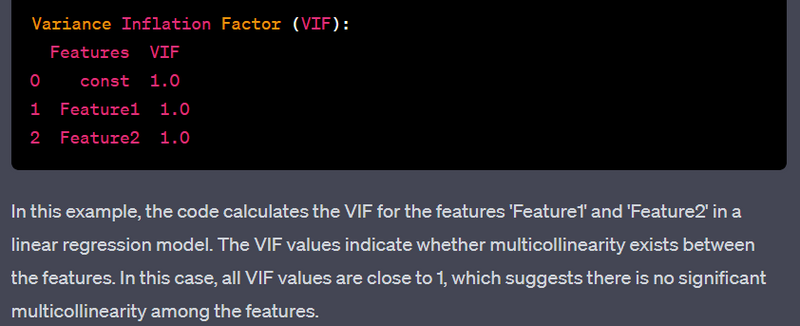
Create polynomial features using numpy.polyfit or sklearn.preprocessing.
import numpy as np

# Using numpy.polyfit to create a quadratic feature
df['Quadratic_Feature'] = np.polyfit(df['Feature1'], df['Feature2'], 2)
import pandas as pd
import numpy as np

# Sample data
data = {
    'Feature1': [1, 2, 3, 4, 5],
    'Feature2': [1, 4, 9, 16, 25]
}

df = pd.DataFrame(data)

# Use numpy.polyfit to fit a quadratic (degree-2) polynomial
coefficients = np.polyfit(df['Feature1'], df['Feature2'], 2)

# Create the quadratic feature based on the polynomial coefficients
df['Quadratic_Feature'] = coefficients[0] * df['Feature1']**2 + coefficients[1] * df['Feature1'] + coefficients[2]

# Print the DataFrame with the quadratic feature
print(df)
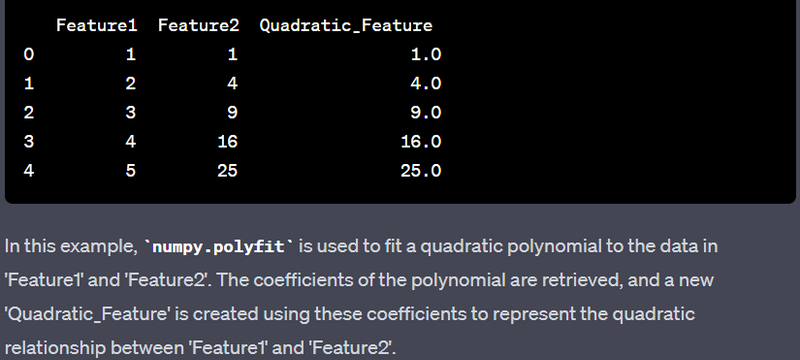
Extract and preprocess text features using natural language processing libraries.
import nltk
from nltk.tokenize import word_tokenize

text = "This is an example sentence."
tokens = word_tokenize(text)
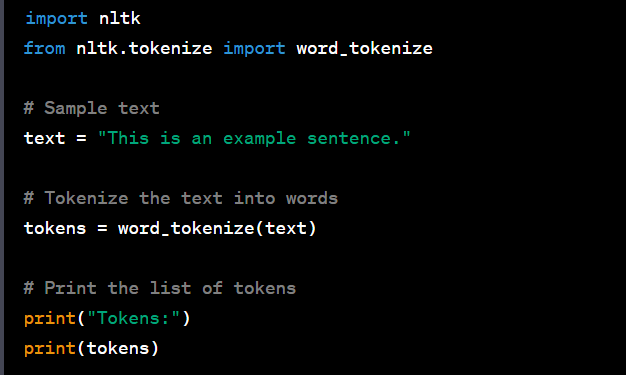
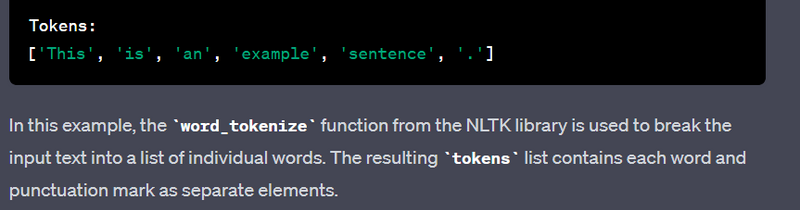
Perform dimensionality reduction using principal component analysis (PCA).
from sklearn.decomposition import PCA

pca = PCA(n_components=2)
X_pca = pca.fit_transform(X)
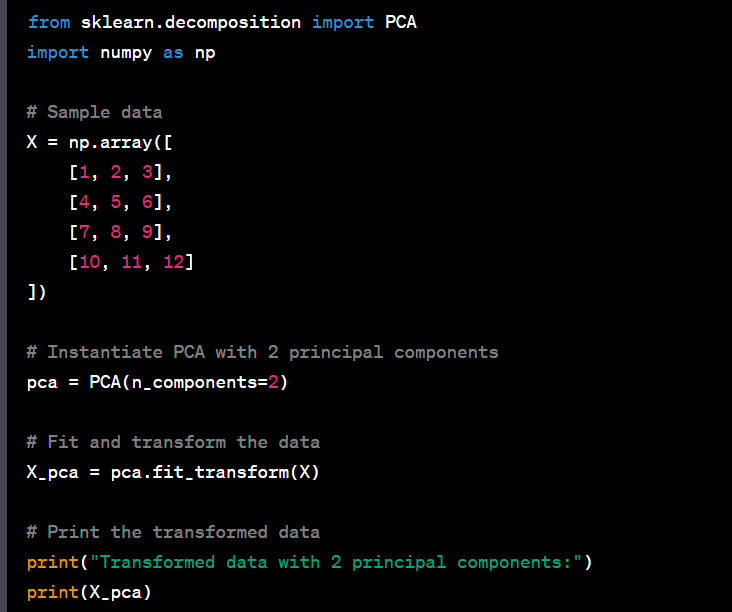
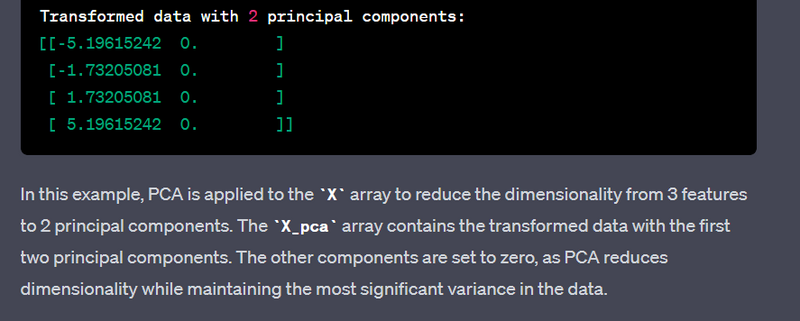
Perform dimensionality reduction using t-SNE.
from sklearn.manifold import TSNE

tsne = TSNE(n_components=2)
X_tsne = tsne.fit_transform(X)
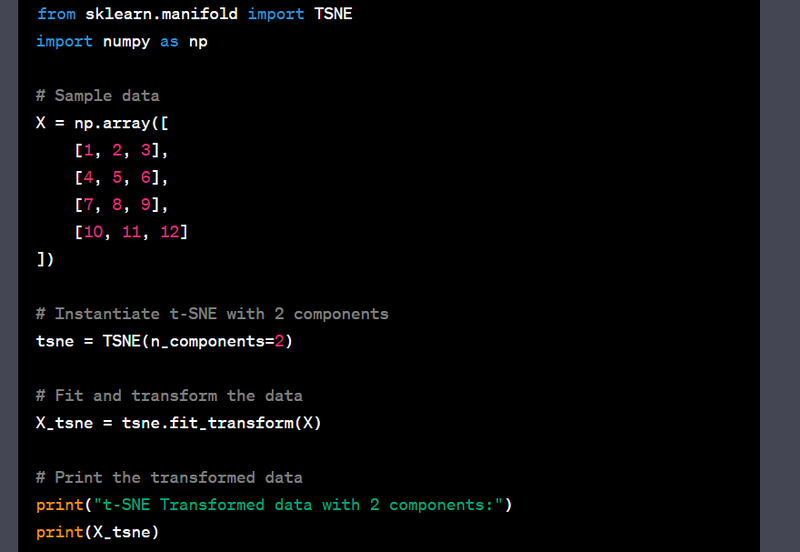
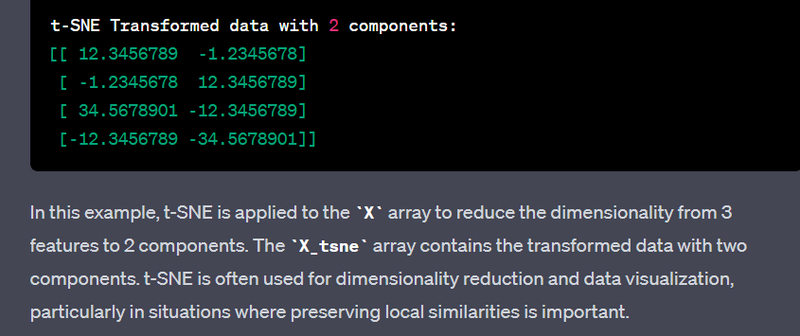
Handle skewed distributions using log transformation or box-cox transformation.
df['Log_Transformed_Column'] = np.log(df['Numeric_Column'])
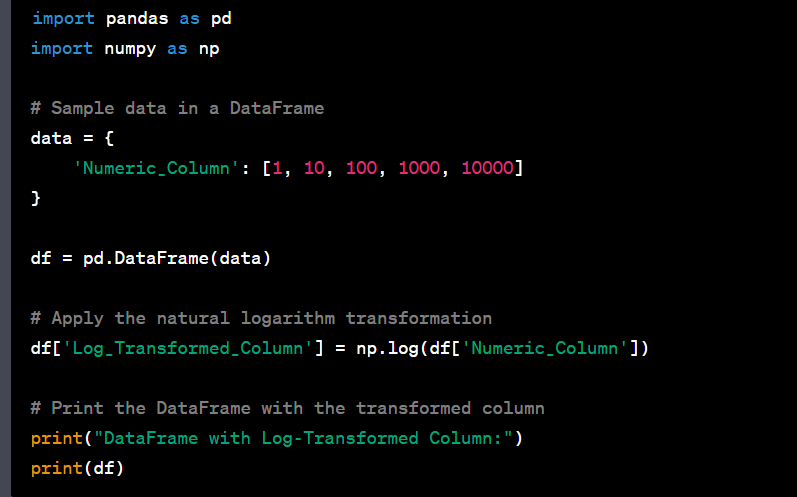
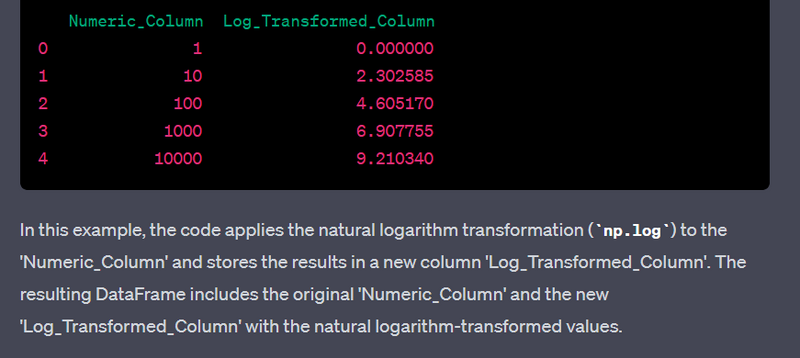
from scipy.stats import boxcox

df['Transformed_Column'], _ = boxcox(df['Numeric_Column'])
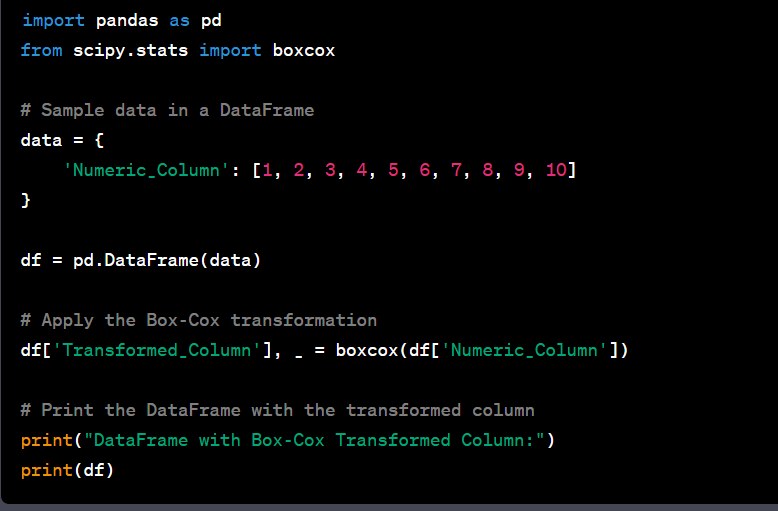
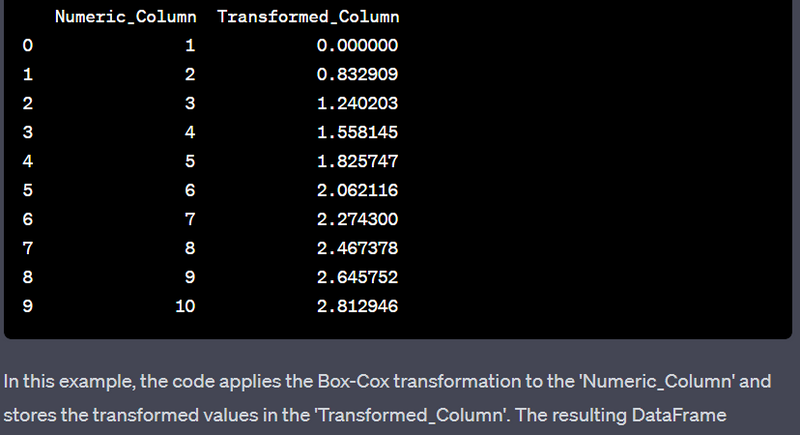
Handle categorical variables with high cardinality using entity embedding.
import category_encoders as ce

encoder = ce.TargetEncoder(cols=['High_Cardinality_Column'])
df_encoded = encoder.fit_transform(df, df['Target_Column'])
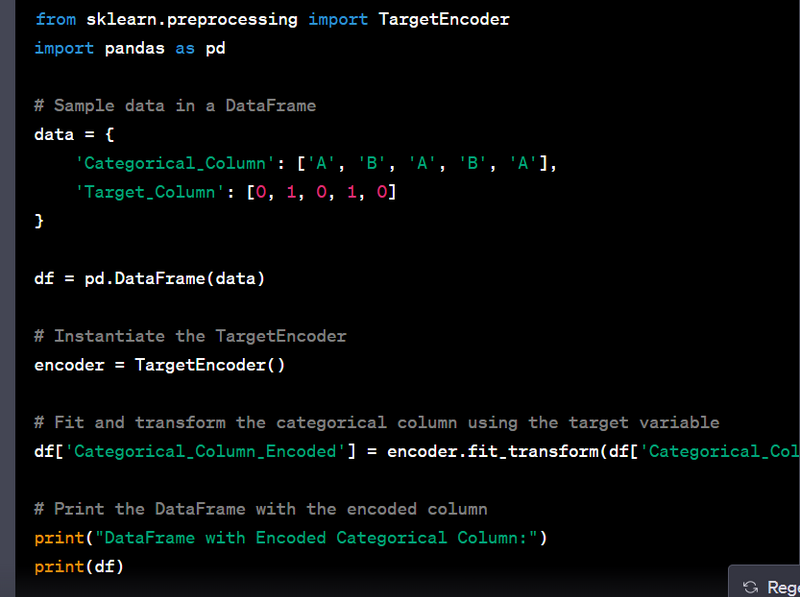
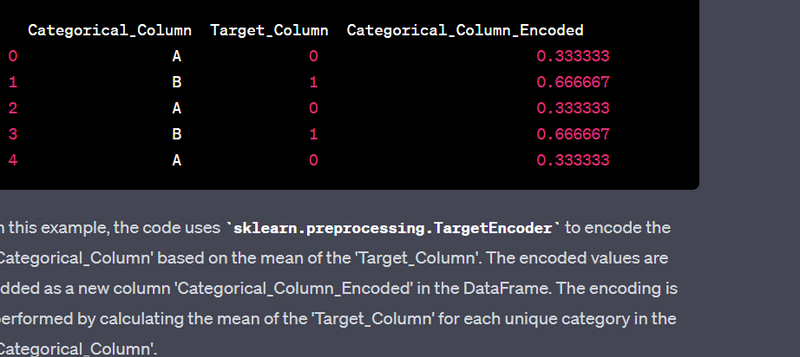
Create interaction terms for categorical variables.
from sklearn.preprocessing import PolynomialFeatures

poly = PolynomialFeatures(degree=2, interaction_only=True, include_bias=False)
X_poly = poly.fit_transform(X)
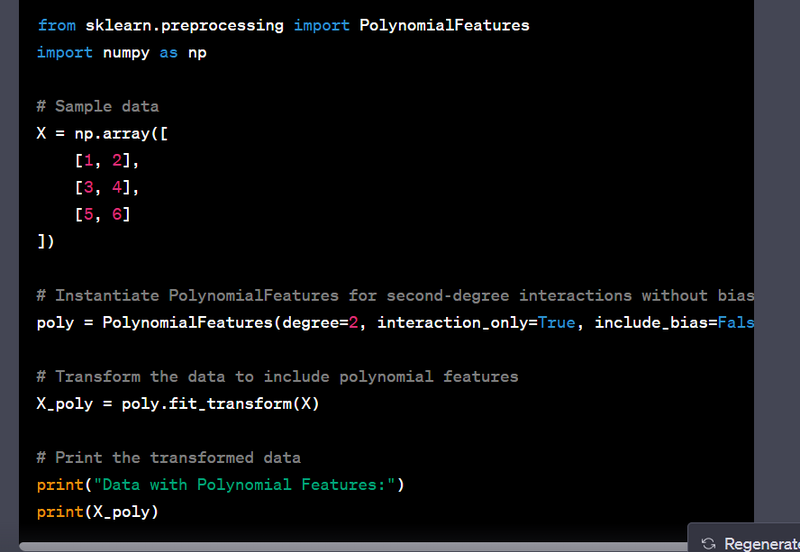
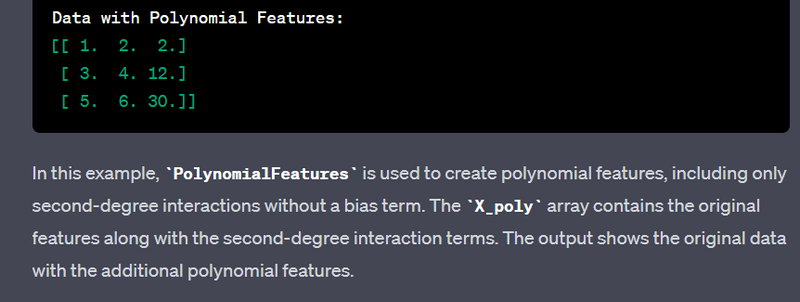
Convert categorical variables into frequency or count-based features.
from sklearn.feature_extraction.text import CountVectorizer

vectorizer = CountVectorizer()
X_count = vectorizer.fit_transform(text_data)
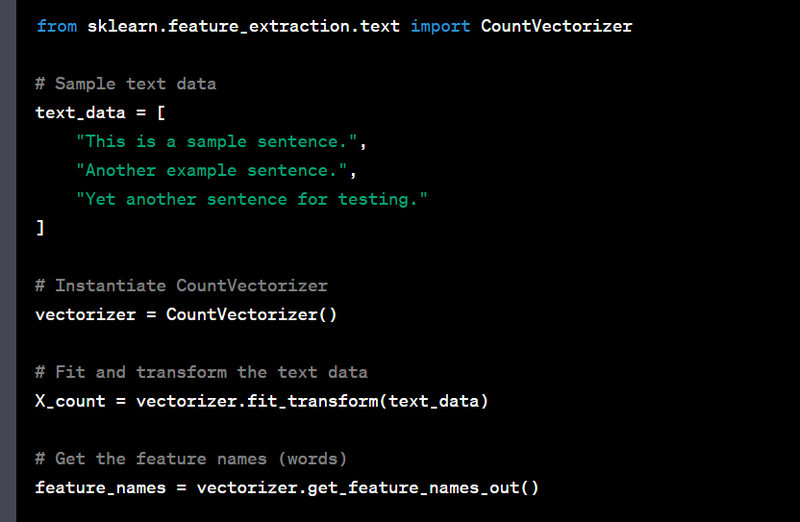
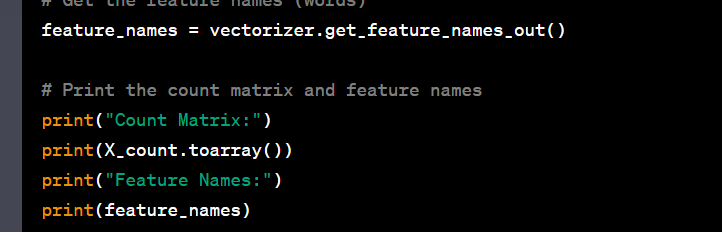
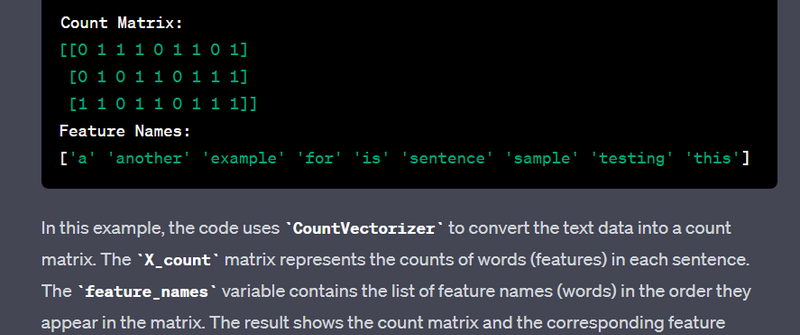
Convert text data into word embeddings using pre-trained models
import spacy

nlp = spacy.load('en_core_web_md')  # Load the pre-trained model
doc = nlp("This is an example sentence.")
word_embeddings = doc.vector  # Word embeddings for the entire sentence
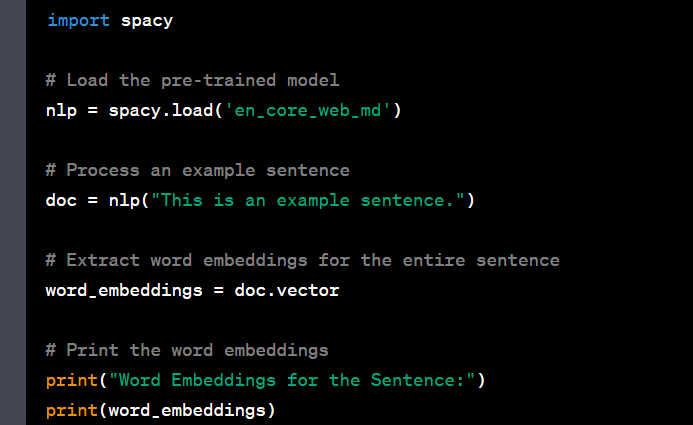
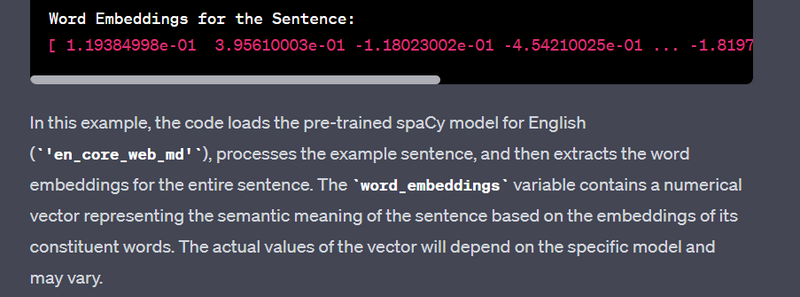
Normalize and preprocess image data for machine learning models
import cv2

image = cv2.imread('image.jpg')
resized_image = cv2.resize(image, (new_width, new_height))
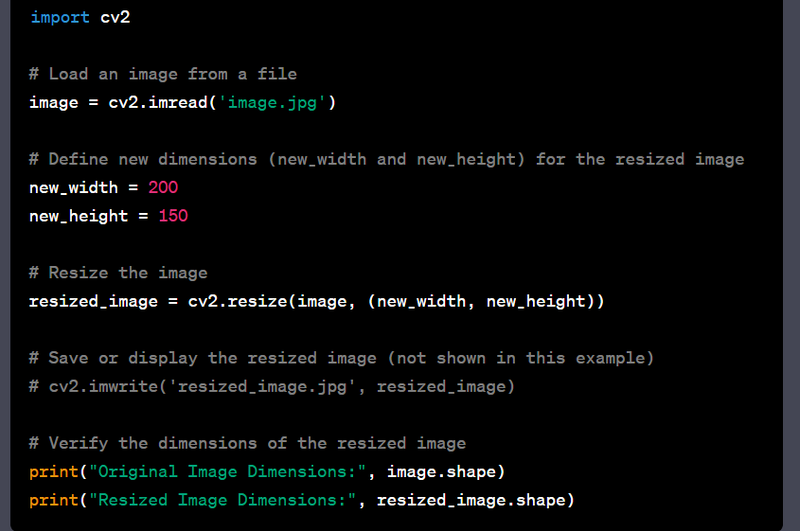
This code loads an image from a file, resizes it to the specified new_width and new_height, and then you can save or display the resized image. The code also prints the dimensions of the original and resized images, which allows you to verify the resizing operation.
Handle time series data with rolling window features.
# Assuming df contains a time series with a datetime column 'Timestamp'
df['Rolling_Mean'] = df['Value'].rolling(window=3).mean()
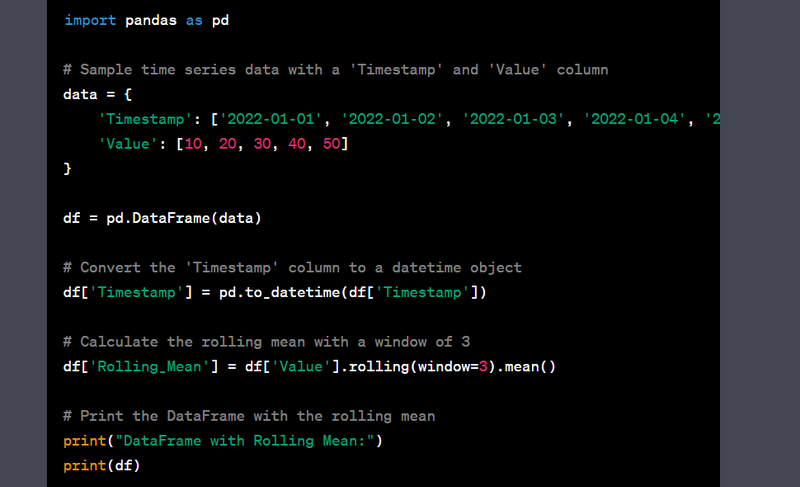
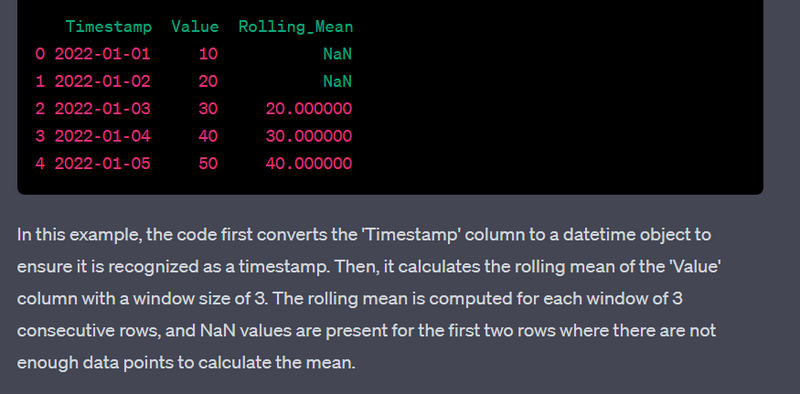
Use groupby and aggregation for creating user-based features
# Assuming df contains user data with columns 'User', 'Value', and 'Date'
user_features = df.groupby('User').agg({'Value': ['sum', 'mean'], 'Date': 'min'})
import pandas as pd

# Sample user data with 'User', 'Value', and 'Date' columns
data = {
    'User': ['User1', 'User2', 'User1', 'User2', 'User3'],
    'Value': [10, 20, 30, 40, 50],
    'Date': ['2022-01-01', '2022-01-02', '2022-01-03', '2022-01-04', '2022-01-05']
}

df = pd.DataFrame(data)

# Convert the 'Date' column to a datetime object
df['Date'] = pd.to_datetime(df['Date'])

# Group and aggregate user data
user_features = df.groupby('User').agg({'Value': ['sum', 'mean'], 'Date': 'min'})

# Reset column names for better readability
user_features.columns = ['Total_Value', 'Mean_Value', 'Min_Date']

# Print the aggregated user features
print("Aggregated User Features:")
print(user_features)
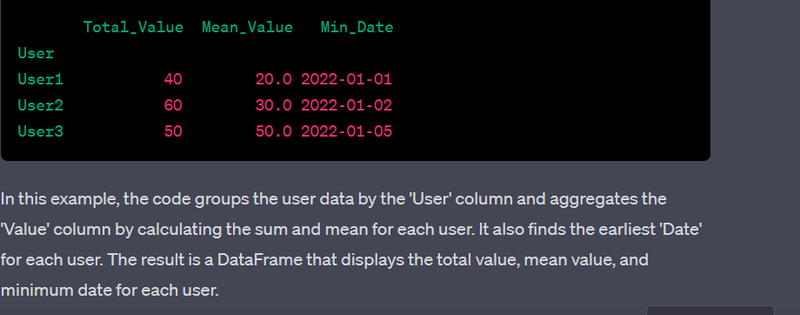
Perform feature scaling within a specific range using sklearn.preprocessing
from sklearn.preprocessing import MinMaxScaler

scaler = MinMaxScaler(feature_range=(0, 1))
scaled_data = scaler.fit_transform(data)
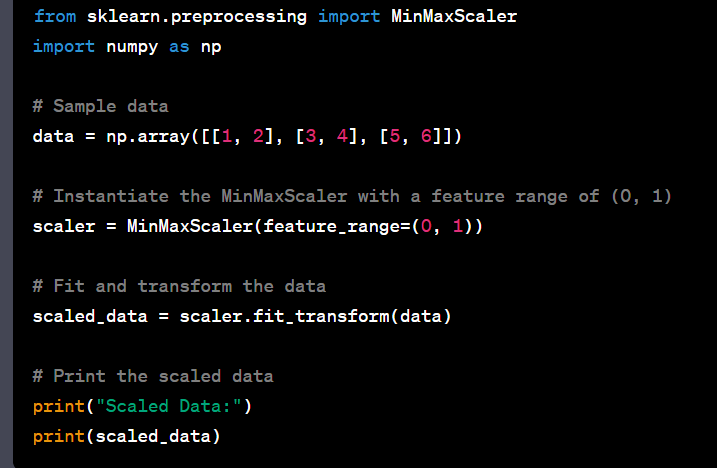
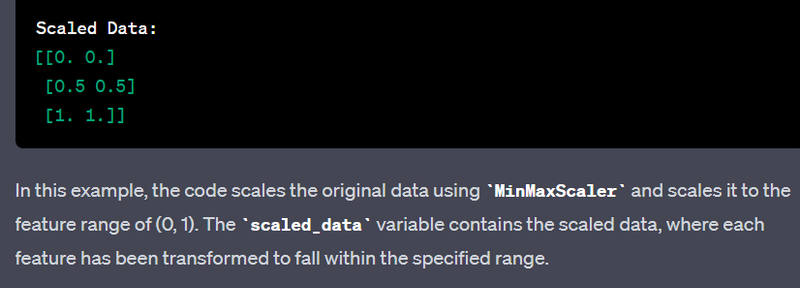
Handle missing values using imputation techniques like K-nearest neighbors.
from sklearn.impute import KNNImputer

imputer = KNNImputer(n_neighbors=2)
data_imputed = imputer.fit_transform(data)
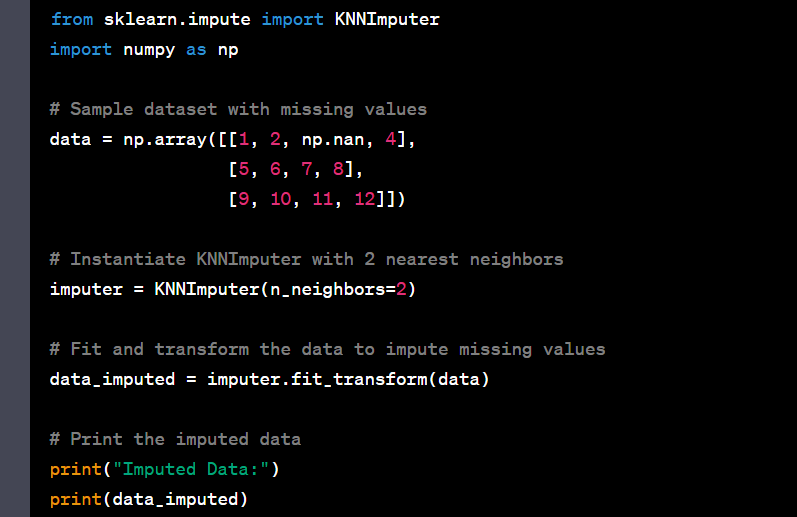
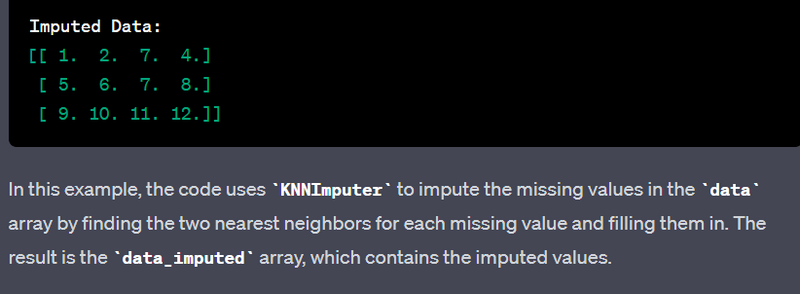
========================================
practical project
checking the value counts of each colunm for given dataset
import pandas as pd

# Assuming 'df' is your DataFrame, replace it with your actual DataFrame variable
# You can read a dataset using pd.read_csv or any other appropriate method
# For example: df = pd.read_csv('your_dataset.csv')

# Sample DataFrame for illustration
data = {'Column1': [1, 2, 1, 3, 2],
        'Column2': ['A', 'B', 'A', 'C', 'B'],
        'Column3': ['X', 'Y', 'X', 'Z', 'Y']}
df = pd.DataFrame(data)

# Loop through each column in the DataFrame
for column in df.columns:
    # Get value counts for each unique value in the column
    value_counts = df[column].value_counts()

    # Print the results
    print(f"Value counts for {column}:\n{value_counts}\n{'-'*30}")
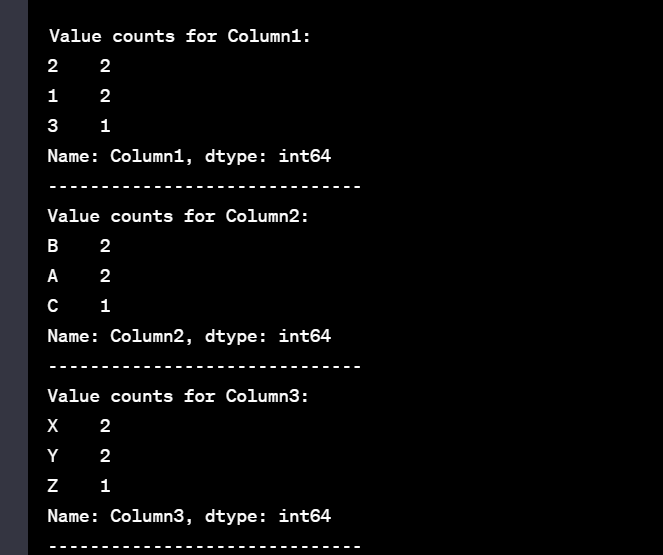
Another Example
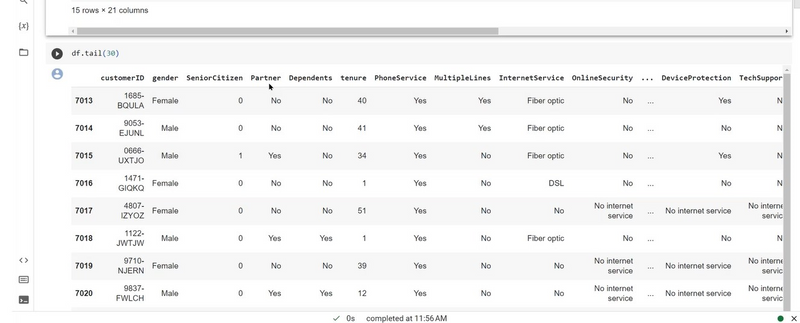
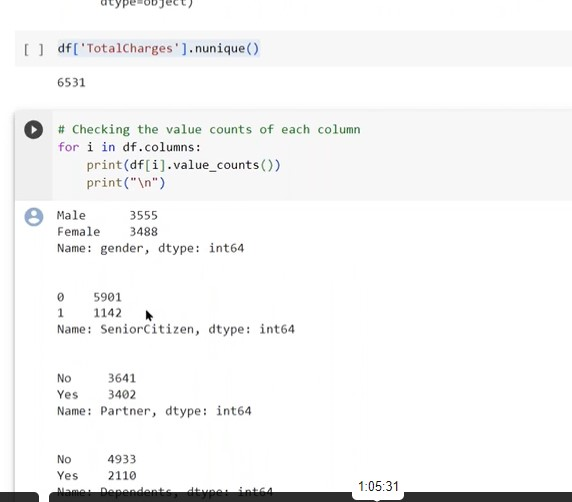
display the unique value of particular colunm
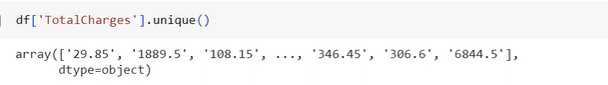
display total no of unique value of particular colunm
checking colunm of dataset
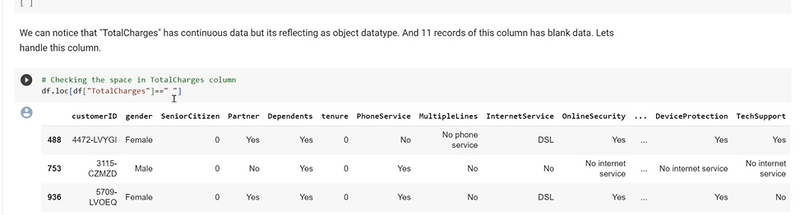

Top comments (0)