display the resource usage information every 5 seconds for a total of 10 times.
monitor CPU usage for the first CPU every 5 seconds
monitor memory usage in megabytes every 5 seconds
monitor disk I/O activity every 5 seconds
memory usage in megabytes and include information about swap space
statistics about the process with PID 1234
display CPU statistics every 1 second
the amount of free memory, and the amount of memory used by buffers and cache
display the system's performance statistics every second for ten seconds
display only the memory, swap, and disk I/O statistics of specific data
calculate the average amount of free memory over the last second
sort the output by the amount of free memory in ascending order
display the last 10 lines of output from vmstat.
the top 10 processes consuming CPU resources
vmstat (short for "virtual memory statistics") is a command-line tool in Linux and Unix systems that provides information about system resource usage, including CPU utilization, memory usage, and input/output (I/O) activity. Here are some examples of how vmstat can be used:
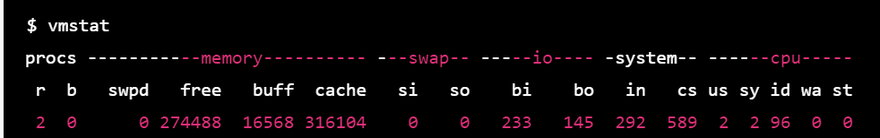
1.Monitor system resource usage: One of the primary uses of vmstat is to monitor system resource usage in real time. By default, vmstat displays the following information:
Procs: The number of processes currently running, including the number of processes waiting for CPU time.
Memory: The amount of free memory available, as well as the amount of memory used for caching and buffering.
Swap: The amount of swap space used.
CPU: The percentage of CPU time spent in user mode, system mode, and idle mode.
I/O: The number of blocks read and written to disk per second.
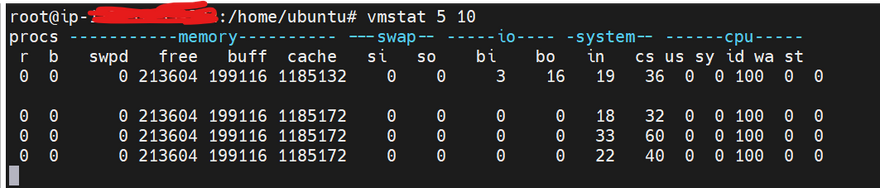
To run vmstat and display this information, simply type the command followed by a delay time (in seconds) and a count (the number of times to display the information):
$ vmstat 5 10
This will display the resource usage information every 5 seconds for a total of 10 times.
2.Monitor CPU usage: You can use vmstat to monitor CPU usage specifically by using the -P option, followed by a CPU number (0 for the first CPU, 1 for the second CPU, and so on). For example, to monitor CPU usage for the first CPU every 5 seconds, use the following command:
$ vmstat -P 0 5
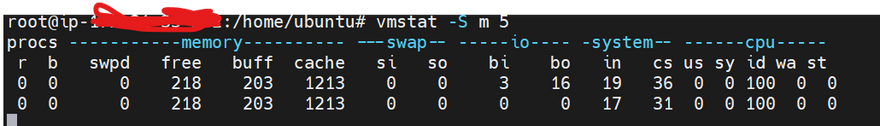
3.Monitor memory usage: You can use vmstat to monitor memory usage specifically by using the -S option, followed by a memory unit (such as "k" for kilobytes or "m" for megabytes). For example, to monitor memory usage in megabytes every 5 seconds, use the following command:
$ vmstat -S m 5
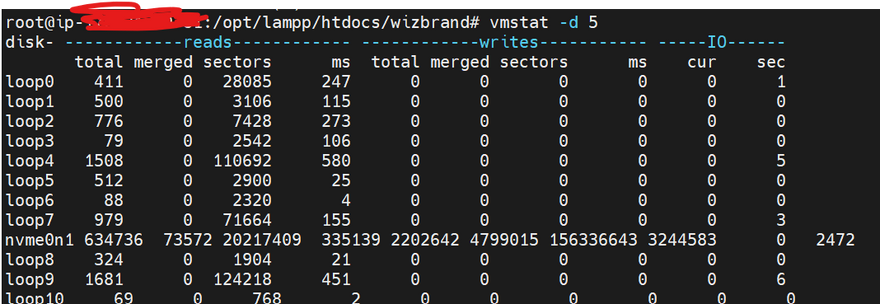
4.Monitor I/O activity: You can use vmstat to monitor I/O activity specifically by using the -d option. This will display information about disk I/O activity, including the number of read and write operations per second. For example, to monitor disk I/O activity every 5 seconds, use the following command:
$ vmstat -d 5
These are just a few examples of how vmstat can be used to monitor system resource usage. There are many other options and configurations available, so be sure to check the man page for more information.
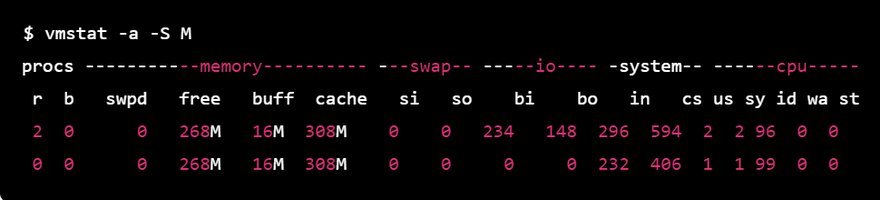
Customizing output: You can use the -a option to display additional information about swap space and memory usage. The -S option can be used to change the units that vmstat reports memory usage in (such as kilobytes or megabytes). For example, the following command will display memory usage in megabytes and include information about swap space:
$ vmstat -a -S M
procs -----------memory---------- ---swap-- -----io---- -system-- ------cpu-----
 r  b   swpd   free   buff  cache   si   so    bi    bo   in   cs us sy id wa st
 2  0      0   268M   16M  308M    0    0   234   148  296  594  2  2 96  0  0
 0  0      0   268M   16M  308M    0    0     0     0  232  406  1  1 99  0  0
Displaying process-related statistics: You can use the -p option to display statistics about specific processes. For example, the following command will display statistics about the process with PID 1234:
$ vmstat -p 1234
vmstat is a Linux command that provides system performance data, including information about the CPU, memory, and I/O. The output of vmstat can be used to identify potential performance issues and take appropriate measures to improve system performance.
Here are some examples of how vmstat can be used to improve system performance:
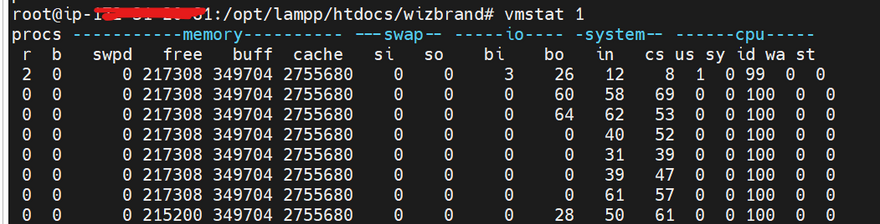
Identifying CPU bottlenecks: Use vmstat to monitor the CPU utilization and identify if the CPU is a bottleneck for the system. For example, running the command
vmstat 1
will display CPU statistics every 1 second. The output will show the percentage of CPU usage, the number of context switches, and the number of interrupts. If the CPU usage is consistently high, you may need to optimize your system's processes or upgrade your CPU.
Analyzing memory usage: Use vmstat to monitor memory usage and identify potential memory-related performance issues. For example, running the command
vmstat -s
will display a summary of memory usage on the system. The output will show the total amount of memory, the amount of free memory, and the amount of memory used by buffers and cache. If you find that the system is consistently running out of memory, you may need to optimize your processes or add more RAM.
Monitoring disk I/O: Use vmstat to monitor disk I/O and identify potential I/O bottlenecks. For example, running the command
vmstat 1
and observing the bi and bo columns will display the number of blocks received and sent per second. If the system is consistently writing or reading large amounts of data, you may need to optimize your disk usage, upgrade your disk or improve your application code to reduce disk access.
Tracking system performance over time: Use vmstat to track system performance over time and identify performance trends. For example, running the command
vmstat 1 10
will display the system's performance statistics every second for ten seconds. By monitoring system performance trends over time, you can identify performance issues before they become critical, and take corrective actions proactively.
In summary, vmstat is a powerful tool that can be used to monitor the performance of your Linux system and identify potential performance issues. By using the output from vmstat, you can take appropriate measures to optimize your system's performance and ensure it is running efficiently.
vmstat helps to improve system performane using linux pipe commands
In addition to using vmstat on its own, it is also possible to use it in conjunction with other Linux commands by piping the output to them. Here are some examples of how to use vmstat with other commands to improve system performance:
Using vmstat with grep: You can use the grep command to filter the output of vmstat and only display the data you are interested in. For example, running the command
vmstat 1 | grep -v procs
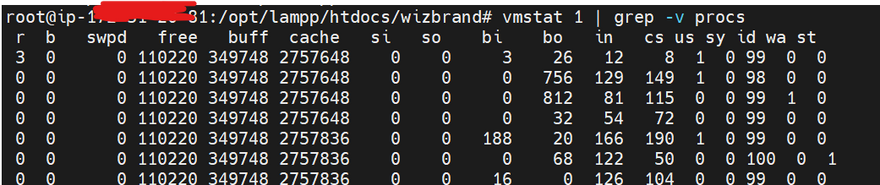
will display only the memory, swap, and disk I/O statistics. This can make it easier to focus on the specific performance metrics that are important to you.
Using vmstat with awk: You can use the awk command to perform more complex operations on the output of vmstat, such as calculating averages and percentiles. For example, running the command
vmstat 1 | awk '{total += $5} END {print total/NR}'
will calculate the average amount of free memory over the last second. This can be useful for tracking system performance over time.
Using vmstat with sort: You can use the sort command to sort the output of vmstat based on a specific column. For example, running the command
vmstat 1 | sort -n -k 5
will sort the output by the amount of free memory in ascending order. This can make it easier to identify memory-related performance issues.
Using vmstat with tail: You can use the tail command to display the most recent lines of output from vmstat. For example, running the command
vmstat 1 | tail -n 10
will display the last 10 lines of output from vmstat. This can be useful for quickly identifying performance issues that have occurred recently.
In summary, piping the output of vmstat to other Linux commands can make it easier to analyze system performance and identify performance issues. By combining vmstat with other commands, you can perform more complex operations on the data and extract more meaningful insights from the system performance metrics.
Display the top processes consuming CPU or memory resources:
To display information about the top processes consuming CPU or memory resources, you can use the "ps" command with the "sort" command and the "head" command. For example, to display the top 10 processes consuming CPU resources, you can use the following command:
Display information about a specific user's processes:
To display information about a specific user's processes, you can use the "ps" command with the "grep" command and the "awk" command. For example, to display information about all processes running by the user "john", you can use the following command:
ps aux | grep john | awk '{print $2, $11}'


Top comments (0)