In statistical hypothesis testing, the null hypothesis and alternative hypothesis are two competing statements about a population parameter or the relationship between variables. They help in making decisions based on observed data. Here's an explanation of the null hypothesis and alternative hypothesis, along with examples:
Null Hypothesis (H₀):
The null hypothesis is the default or initial assumption that there is no significant difference or relationship between variables or that the population parameter takes a specific value. It is often denoted as H₀.
Example 1: Suppose you want to test whether a new drug has any effect on a certain medical condition. The null hypothesis could be: "The new drug has no effect on the medical condition."
Example 2: Consider a study examining the mean height of men and women. The null hypothesis could be: "There is no significant difference in the mean height between men and women."
Alternative Hypothesis (H₁ or Hₐ):
The alternative hypothesis contradicts the null hypothesis and suggests that there is a significant difference or relationship between variables or that the population parameter takes a different value. It represents the possibility that the observed data deviates from what is expected under the null hypothesis. The alternative hypothesis can take different forms, depending on the research question.
Example 1 (Two-sided alternative): For the new drug example, the alternative hypothesis could be: "The new drug has an effect on the medical condition, either positive or negative."
Example 2 (One-sided alternative): For the height comparison example, if you specifically want to test if men are taller than women, the alternative hypothesis could be: "The mean height of men is significantly greater than the mean height of women."
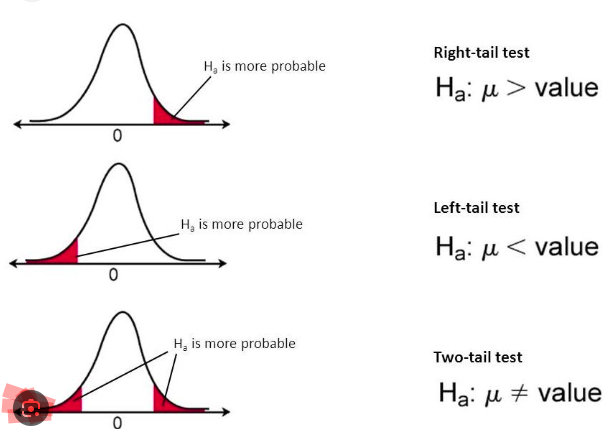
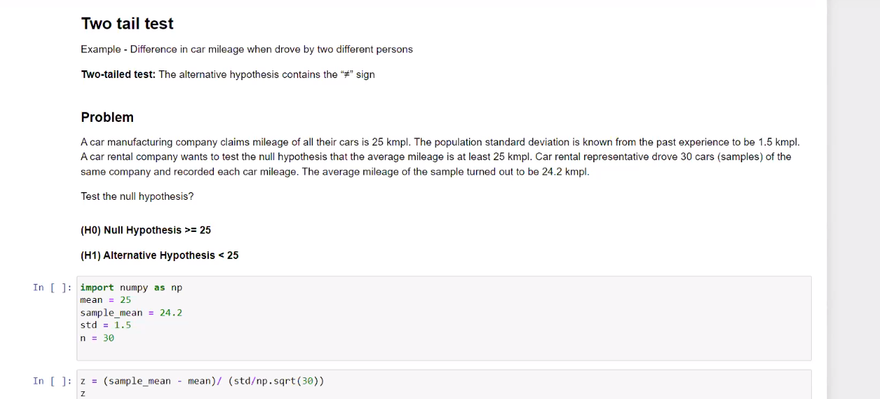
The choice between a one-sided (also called one-tailed) or two-sided (two-tailed) alternative hypothesis depends on the research question and the specific hypothesis being tested. A one-sided alternative focuses on a specific direction of effect, while a two-sided alternative considers any significant difference or relationship.
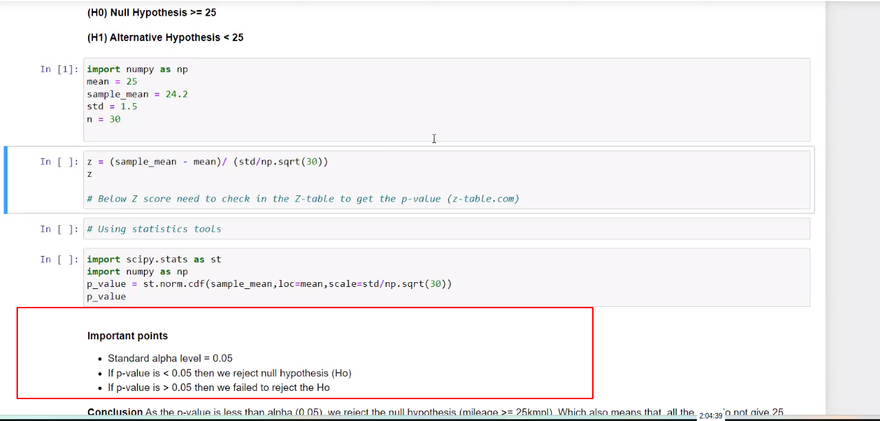
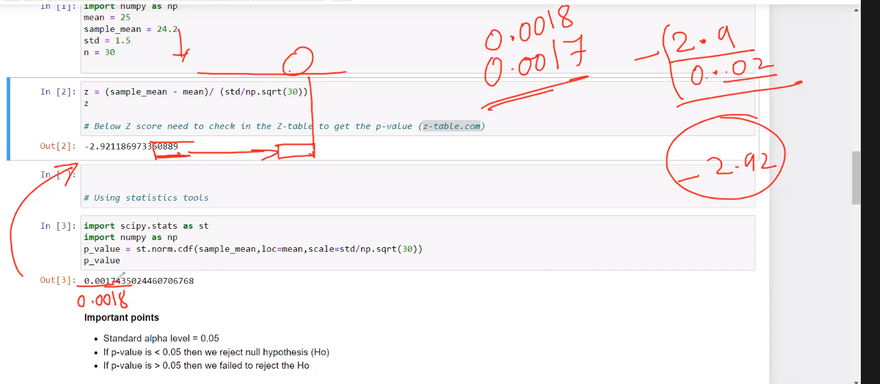
During hypothesis testing, statistical analysis is performed on the data to determine the likelihood of observing the data under the null hypothesis. If the evidence strongly contradicts the null hypothesis, it may lead to rejecting the null hypothesis in favor of the alternative hypothesis, suggesting that there is a significant difference or relationship. However, if there is insufficient evidence, the null hypothesis may not be rejected.
It's important to note that the null hypothesis is not necessarily the hypothesis of no effect or no difference. It is a statement of no significant difference or relationship based on the available evidence and the assumptions being tested.
Here's an example code in Python that demonstrates how to calculate the null hypothesis and alternative hypothesis using real exam scores and the normal distribution formula from the scipy.stats module:
import numpy as np
from scipy import stats

# Example: Comparing exam scores of two groups
# Null hypothesis: There is no significant difference in the mean scores of two groups.
# Alternative hypothesis: There is a significant difference in the mean scores of two groups.

# Group A scores
group_a_scores = np.array([80, 85, 90, 95, 92, 88, 82, 78, 86, 91])

# Group B scores
group_b_scores = np.array([75, 78, 83, 88, 80, 85, 92, 87, 79, 81])

# Calculate sample statistics
mean_a = np.mean(group_a_scores)
mean_b = np.mean(group_b_scores)
std_a = np.std(group_a_scores)
std_b = np.std(group_b_scores)
n_a = len(group_a_scores)
n_b = len(group_b_scores)

# Calculate t-statistic
t_statistic = (mean_a - mean_b) / np.sqrt((std_a**2 / n_a) + (std_b**2 / n_b))

# Degrees of freedom
dof = n_a + n_b - 2

# Calculate p-value
p_value = 2 * (1 - stats.t.cdf(abs(t_statistic), dof))

# Print the results
print("Independent Two-sample t-test:")
print("Null Hypothesis: There is no significant difference in the mean scores of two groups.")
print("Alternative Hypothesis: There is a significant difference in the mean scores of two groups.")
print("T-Statistic:", t_statistic)
print("P-Value:", p_value)
print("----------------------------------------")
In this code, we compare the exam scores of two groups, Group A and Group B. The null hypothesis states that there is no significant difference in the mean scores of the two groups, while the alternative hypothesis suggests that there is a significant difference.
The code calculates the sample statistics, including the means (mean_a and mean_b), standard deviations (std_a and std_b), and sample sizes (n_a and n_b). It then uses these values to calculate the t-statistic using the formula (mean_a - mean_b) / sqrt((std_a*2 / n_a) + (std_b*2 / n_b)).
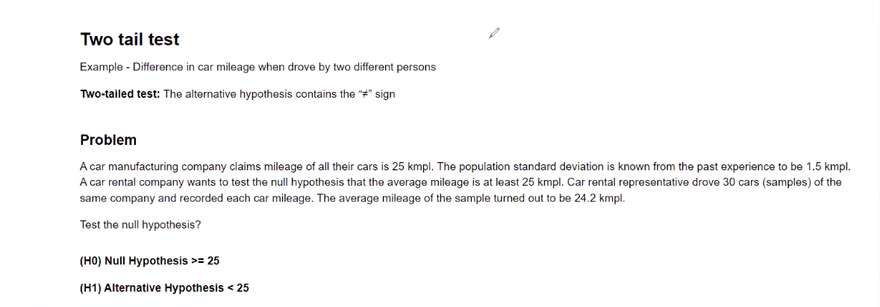
The degrees of freedom (dof) are calculated as the sum of the sample sizes minus 2. Finally, the p-value is computed using the cumulative distribution function (stats.t.cdf()) of the t-distribution, multiplied by 2 to account for the two-tailed test.
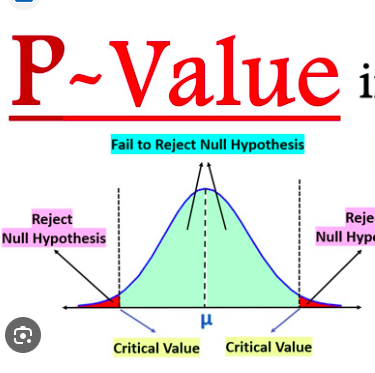
The output will display the calculated t-statistic and p-value. Based on the p-value, you can determine whether to reject the null hypothesis or not.

Top comments (0)