Sure, here's a list of 50 programming questions focused on using NumPy and pandas libraries in Python for data manipulation, analysis, and processing:
NumPy Questions:
- Create a NumPy array from a Python list.
- Find the mean, median, and standard deviation of a NumPy array.
- Perform element-wise addition, subtraction, multiplication, and division of two arrays.
- Reshape a 1D array into a 2D array.
- Extract even and odd elements from a NumPy array.
- Create an identity matrix using NumPy.
- Find the index of the maximum and minimum value in an array.
- Normalize the values in an array to have a mean of 0 and standard deviation of 1.
- Create a NumPy array with random values.
- Sort a NumPy array in ascending and descending order.
- Multiply two matrices using NumPy.
- Find the dot product of two arrays.
- Concatenate two arrays horizontally and vertically.
- Perform element-wise comparisons between two arrays.
- Find the unique values and their counts in an array.
- Replace all negative values in an array with zeros.
- Create a NumPy array with evenly spaced values.
- Calculate the cumulative sum of an array.
- Calculate the eigenvalues and eigenvectors of a matrix.
- Find the index of the top N maximum values in an array.
Question: How do you create a NumPy array with values from 0 to 9 and then extract the element at index 3?
import numpy as np
arr = np.arange(10)
element = arr[3]
print(element)
Output: 3
Question: Given a NumPy array arr, how can you extract the first 5 elements from it?
import numpy as np
arr = np.array([0, 1, 2, 3, 4, 5, 6, 7, 8, 9])
first_five = arr[:5]
print(first_five)
Output: [0 1 2 3 4]
Question: Create a 2D NumPy array with shape (3, 3) and extract the element at row 2, column 1.
import numpy as np
arr = np.array([[1, 2, 3], [4, 5, 6], [7, 8, 9]])
element = arr[2, 1]
print(element)
Output: 8
Question: Given a NumPy array arr, how do you reverse the order of its elements?
import numpy as np
arr = np.array([1, 2, 3, 4, 5])
reversed_arr = arr[::-1]
print(reversed_arr)
Output: [5 4 3 2 1]
Question: Create a 2D NumPy array of shape (4, 4) and extract the subarray from rows 1 to 2 and columns 2 to 3.
import numpy as np
arr = np.array([[1, 2, 3, 4], [5, 6, 7, 8], [9, 10, 11, 12], [13, 14, 15, 16]])
subarray = arr[1:3, 2:4]
print(subarray)
Output:
[[ 7  8]
 [11 12]]
Question: Given a 1D NumPy array, how can you extract all elements except the first and last?
import numpy as np
arr = np.array([1, 2, 3, 4, 5])
middle_elements = arr[1:-1]
print(middle_elements)
Output: [2 3 4]
Question: Create a 2D NumPy array with shape (3, 4) and extract the last column.
import numpy as np
arr = np.array([[1, 2, 3, 4], [5, 6, 7, 8], [9, 10, 11, 12]])
last_column = arr[:, -1]
print(last_column)
Output: [ 4 8 12]
Question: Given a 2D NumPy array matrix, how can you extract the second row as a 1D array?
import numpy as np
matrix = np.array([[1, 2, 3], [4, 5, 6], [7, 8, 9]])
second_row = matrix[1, :]
print(second_row)
Output: [4 5 6]
Question: Create a 2D NumPy array with shape (5, 5) and extract the diagonal elements.
import numpy as np
arr = np.arange(25).reshape(5, 5)
diagonal_elements = np.diag(arr)
print(diagonal_elements)
Output: [ 0 6 12 18 24]
Question: Given a 1D NumPy array arr, how can you extract elements at even indices?
import numpy as np
arr = np.array([0, 1, 2, 3, 4, 5, 6])
even_indices = arr[::2]
print(even_indices)
Output: [0 2 4 6]
.
points
Normalize the values in an array to have a mean of 0 and standard deviation of 1
np.reshape(2,3)
np.argmax(arr)
np.random.randint(0,10,2)
np.random.rand(5)
np.randn(5)
np.sort(arr)[::-1]
np.hstack
np.vstack
np.clip
np.linspace
np.argsort(-array)[:n]
Basic NumPy Concepts:
What is NumPy?
a. A numerical optimization library
b. A deep learning framework
c. A library for numerical computing in Python [Correct Answer]
d. A web development framework
Which of the following is the primary data structure in NumPy for handling multi-dimensional arrays?
a. List
b. Tuple
c. ndarray (Numpy array) [Correct Answer]
d. DataFrame
What is the purpose of broadcasting in NumPy?
a. To perform element-wise operations on arrays of different shapes
b. To create random arrays
c. To convert arrays into lists
d. To write custom functions for array manipulation
In NumPy, what does the term "dtype" refer to?
a. A function for data type conversion
b. A Python data type
c. The data type of elements in a NumPy array [Correct Answer]
d. A random number generator
How can you create a NumPy array filled with zeros of a specified shape?
a. numpy.zeros(shape) [Correct Answer]
b. numpy.ones(shape)
c. numpy.empty(shape)
d. numpy.random.rand(shape)
Array Creation and Manipulation:
Which function is used to create an identity matrix in NumPy?
a. numpy.identity(n)
b. numpy.ones((n, n))
c. numpy.eye(n)
d. All of the above [Correct Answer]
How do you reshape an existing NumPy array with dimensions (3, 4) into a (4, 3) array?
a. You cannot reshape it without changing the data.
b. array.reshape(4, 3) [Correct Answer]
c. array.resize(4, 3)
d. array.rearrange(4, 3)
What is the purpose of the numpy.arange() function?
a. To create a range of evenly spaced values [Correct Answer]
b. To compute the variance of an array
c. To perform matrix multiplication
d. To calculate the mean of an array
How can you concatenate two NumPy arrays vertically?
a. numpy.concat(array1, array2, axis=0)
b. numpy.vertical_concat(array1, array2)
c. numpy.vstack((array1, array2)) [Correct Answer]
d. numpy.concatenate(array1, array2, axis=1)
What does the numpy.split() function do?
a. It randomly shuffles the elements in an array.
b. It splits an array into multiple sub-arrays along a specified axis. [Correct Answer]
c. It computes the dot product of two arrays.
d. It calculates the eigenvalues of a matrix.
Array Indexing and Slicing:
How do you access the element in the second row and third column of a NumPy array named arr?
a. arr[2, 3]
b. arr[1, 2]
c. arr[1][2]
d. arr[1][3] [Correct Answer]
What is the result of the expression arr[1:4] when applied to a NumPy array?
a. The elements from index 1 to 4, excluding the element at index 4.
b. The elements from index 1 to 3.
c. The elements at index 1 and 4.
d. The elements from index 1 to 4, including the element at index 4. [Correct Answer]
How do you extract all elements from the third column of a NumPy array arr?
a. arr[3, :]
b. arr[:, 3] [Correct Answer]
c. arr[3][0]
d. arr[0][3]
What is the purpose of boolean indexing in NumPy?
a. To perform logical operations on arrays
b. To filter and select elements from an array based on a condition [Correct Answer]
c. To create arrays of random Boolean values
d. To calculate the determinant of a matrix
Array Operations:
How do you perform element-wise addition of two NumPy arrays, arr1 and arr2?
a. arr1.add(arr2)
b. arr1 + arr2 [Correct Answer]
c. numpy.add(arr1, arr2)
d. numpy.sum(arr1, arr2)
What is the result of the expression numpy.dot(arr1, arr2)?
a. Element-wise multiplication of arr1 and arr2
b. Matrix multiplication of arr1 and arr2 [Correct Answer]
c. The sum of elements in arr1 and arr2
d. The mean of elements in arr1 and arr2
How can you find the maximum value in a NumPy array?
a. numpy.maximum(array)
b. numpy.max(array) [Correct Answer]
c. array.max()
d. array.maximum()
What NumPy function is used to calculate the mean of a given array?
a. numpy.average(array)
b. numpy.mean(array) [Correct Answer]
c. numpy.median(array)
d. array.mean()
Array Broadcasting:
In NumPy broadcasting, what happens when you perform operations between arrays with different shapes?
a. An error is raised.
b. The arrays are resized to have the same shape.
c. NumPy automatically expands the smaller array to match the shape of the larger array, element-wise. [Correct Answer]
d. The operation is performed only on the overlapping elements.
Certainly! Continuing from where we left off:
When can broadcasting in NumPy be used?
a. Only when arrays have the same shape
b. When you want to perform element-wise operations on arrays with compatible shapes, including cases where one or more dimensions are missing (e.g., scalar operations) [Correct Answer]
c. Only when arrays have the same data type
d. When you want to perform matrix multiplication
Advanced NumPy Concepts:
What is the purpose of the numpy.linalg module in NumPy?
a. To perform element-wise operations on arrays
b. To handle missing values in arrays
c. To provide linear algebra functions for array operations [Correct Answer]
d. To generate random arrays
How do you find the eigenvalues of a square matrix using NumPy?
a. numpy.eigenvalues(matrix)
b. numpy.calculate_eigenvalues(matrix)
c. numpy.linalg.eigvals(matrix) [Correct Answer]
d. numpy.matrix_eigenvalues(matrix)
What is the primary use of the numpy.random module in NumPy?
a. To generate random numbers and arrays [Correct Answer]
b. To perform random permutations of arrays
c. To shuffle elements within an array
d. To compute the standard deviation of an array
What is the purpose of the numpy.save() and numpy.load() functions in NumPy?
a. To save and load CSV files
b. To save and load images
c. To save and load NumPy arrays to/from disk [Correct Answer]
d. To save and load Python scripts
What is NumPy's universal function (ufunc)?
a. A function that works with universal data types
b. A function that can be applied element-wise to NumPy arrays, optimizing performance and readability [Correct Answer]
c. A function that works only with complex numbers
d. A function that is specific to a particular application
NumPy for Data Manipulation:
How can you find the unique values in a NumPy array?
a. numpy.unique(array)
b. array.unique()
c. numpy.find_unique(array)
d. numpy.unique_values(array) [Correct Answer]
What is the purpose of the numpy.where() function?
a. To create a new array with specified values
b. To filter and locate elements that satisfy a condition in an array [Correct Answer]
c. To reshape an array
d. To find the maximum value in an array
How do you calculate the element-wise absolute values of a NumPy array?
a. numpy.abs(array)
b. numpy.absolute(array)
c. numpy.absolutes(array)
d. All of the above [Correct Answer]
What is the difference between numpy.copy() and simple assignment (=) when copying a NumPy array?
a. There is no difference; both methods create a deep copy.
b. numpy.copy() creates a deep copy, while simple assignment creates a shallow copy [Correct Answer]
c. numpy.copy() is used for copying strings, and simple assignment is used for arrays.
d. numpy.copy() is more memory-efficient than simple assignment.
How can you calculate the cumulative sum of elements in a NumPy array?
a. numpy.cumsum(array) [Correct Answer]
b. array.cumulative_sum()
c. numpy.sum(array, cumulative=True)
d. numpy.add.accumulate(array)
What is the purpose of the numpy.arange() function in NumPy?
a. To create an array with evenly spaced values within a specified range [Correct Answer]
b. To create an array with random values
c. To calculate the average of an array
d. To reshape an array
What is the correct syntax for using numpy.arange() to create an array with values from 0 to 9 (inclusive)?
a. numpy.arange(0, 10)
b. numpy.arange(10)
c. numpy.arange(0, 10, 1) [Correct Answer]
d. numpy.arange(0, 9, 1)
How can you create an array with values from 2 to 10 (inclusive) with a step size of 2 using numpy.arange()?
a. numpy.arange(2, 10, 2) [Correct Answer]
b. numpy.arange(2, 11, 2)
c. numpy.arange(2, 8, 2)
d. numpy.arange(2, 9, 2)
What is the data type of the array created by numpy.arange(5)?
a. float
b. int [Correct Answer]
c. str
d. bool
What is the difference between numpy.arange() and numpy.linspace()?
a. There is no difference; they are interchangeable.
b. numpy.arange() creates an array with evenly spaced values at specified intervals, while numpy.linspace() creates an array with a specified number of evenly spaced values over a specified range. [Correct Answer]
c. numpy.arange() creates an array with random values, while numpy.linspace() creates an array with sequential values.
d. numpy.arange() only works with integers, while numpy.linspace() works with floating-point numbers.
If you want to create an array with values from 1 to 5 (inclusive) using numpy.arange(), what is the correct syntax?
a. numpy.arange(1, 5)
b. numpy.arange(5)
c. numpy.arange(1, 6) [Correct Answer]
d. numpy.arange(0, 5)
What will numpy.arange(3, -3, -1) produce?
a. An empty array
b. [3, 2, 1, 0, -1, -2] [Correct Answer]
c. [3, 1, -1]
d. [3, 0, -3]
Which argument(s) in the numpy.arange() function are optional?
a. None, all arguments are required.
b. stop is optional, while start and step are required. [Correct Answer]
c. start and stop are optional, while step is required.
d. step is optional, while start and stop are required.
What is the result of numpy.arange(5, 1, -1.5)?
a. [5, 3.5, 2]
b. [5.0, 3.5, 2.0] [Correct Answer]
c. An error is raised because numpy.arange() only works with integers.
d. [5, 3, 1]
How can you create an array with values from 0 to 10 (inclusive) in steps of 2 using numpy.arange()?
a. numpy.arange(0, 10, 2)
b. numpy.arange(0, 11, 2)
c. numpy.arange(2, 10, 2) [Correct Answer]
d. numpy.arange(2, 11, 2)
Pandas Questions
- Read a CSV file into a pandas DataFrame.
- Display the first few rows and last few rows of a DataFrame.
- Select a specific column from a DataFrame.
- Filter rows based on a condition.
- Calculate summary statistics for a column (mean, median, etc.).
- Group and aggregate data in a DataFrame.
- Merge two DataFrames based on a common column.
- Sort a DataFrame based on a specific column.
- Drop missing values from a DataFrame.
- Fill missing values in a DataFrame with a specific value.
- Pivot a DataFrame to create a summary table.
- Apply a function to each element in a DataFrame.
- Create a new column by combining existing columns.
- Reshape a DataFrame using the melt function.
- Rename columns in a DataFrame.
- Calculate the correlation between columns.
- Perform string operations on a column.
- Perform date and time operations on a column.
- Filter rows with dates falling within a specific range.
- Perform a left join, right join, inner join, and outer join.
- Compute the rolling mean or rolling sum of a column.
- Convert a DataFrame to a NumPy array.
- Extract unique values from a column and create a new DataFrame.
- Create a cross-tabulation table from two columns.
- Normalize values in a column using z-score
.
import pandas as pd

# Read a CSV file into a pandas DataFrame
data = pd.read_csv('sample_data.csv')

# Display the first few rows of the DataFrame
print("First few rows:")
print(data.head())

# Display the last few rows of the DataFrame
print("\nLast few rows:")
print(data.tail())

# Select a specific column from the DataFrame
selected_column = data['Age']  # Assuming 'Age' is a column in the dataset

# Filter rows based on a condition
filtered_data = data[data['Salary'] > 50000]  # Filter rows where Salary is greater than 50000

# Calculate summary statistics for a column
mean_age = data['Age'].mean()
median_salary = data['Salary'].median()

# Group and aggregate data in a DataFrame
grouped_data = data.groupby('Department')['Salary'].sum()

# Merge two DataFrames based on a common column
df1 = pd.DataFrame({'EmployeeID': [1, 2, 3], 'Department': ['HR', 'IT', 'Finance']})
df2 = pd.DataFrame({'EmployeeID': [2, 3, 4], 'Manager': ['Alice', 'Bob', 'Charlie']})
merged_data = pd.merge(df1, df2, on='EmployeeID')

# Sort a DataFrame based on a specific column
sorted_data = data.sort_values(by='Age', ascending=False)  # Sort by Age in descending order

# Drop missing values from a DataFrame
cleaned_data = data.dropna()

# Fill missing values in a DataFrame with a specific value
filled_data = data.fillna({'Salary': 0, 'Age': 30})  # Fill missing Salary with 0, Age with 30

# Pivot a DataFrame to create a summary table
pivot_table = data.pivot_table(index='Department', values='Salary', aggfunc='mean')

# Apply a function to each element in a DataFrame with real output
def double_salary(salary):
    return salary * 2

data['DoubledSalary'] = data['Salary'].apply(double_salary)  # Create a new column with doubled salary

# Display the results of each operation
print("\nSelected Column (Age):")
print(selected_column)

print("\nFiltered Data (Salary > 50000):")
print(filtered_data)

print("\nMean Age:")
print(mean_age)

print("\nMedian Salary:")
print(median_salary)

print("\nGrouped and Aggregated Data (Sum of Salaries by Department):")
print(grouped_data)

print("\nMerged Data:")
print(merged_data)

print("\nSorted Data (by Age in Descending Order):")
print(sorted_data)

print("\nCleaned Data (Missing Values Dropped):")
print(cleaned_data)

print("\nFilled Data (Missing Values Filled):")
print(filled_data)

print("\nPivot Table (Mean Salary by Department):")
print(pivot_table)

print("\nApplied Function to Column (Doubled Salary):")
print(data[['Salary', 'DoubledSalary']])
import pandas as pd
import numpy as np

# Create a sample DataFrame
data = {
    'Name': ['Alice', 'Bob', 'Charlie', 'David', 'Eva'],
    'Age': [25, 30, 28, 22, 35],
    'Salary': [50000, 60000, 75000, 55000, 80000],
    'Department': ['HR', 'IT', 'Finance', 'IT', 'Finance'],
    'JoinDate': ['2021-01-15', '2020-05-20', '2019-11-10', '2021-03-01', '2018-09-05']
}
df = pd.DataFrame(data)

# Create a new column by combining existing columns
df['FullName'] = df['Name'] + ' (' + df['Department'] + ')'

# Reshape the DataFrame using the melt function
melted_df = pd.melt(df, id_vars=['Name', 'Department'], value_vars=['Age', 'Salary'], var_name='Attribute', value_name='Value')

# Rename columns in the DataFrame
df.rename(columns={'Age': 'YearsOld', 'Salary': 'Income'}, inplace=True)

# Calculate the correlation between columns
correlation = df['YearsOld'].corr(df['Income'])

# Perform string operations on a column
df['NameLength'] = df['Name'].apply(len)

# Perform date and time operations on a column
df['JoinDate'] = pd.to_datetime(df['JoinDate'])
df['YearsSinceJoining'] = pd.to_datetime('today') - df['JoinDate']
df['YearsSinceJoining'] = df['YearsSinceJoining'].dt.days // 365

# Filter rows with dates falling within a specific range
filtered_df = df[(df['YearsSinceJoining'] >= 2) & (df['YearsSinceJoining'] <= 5)]

# Create a second DataFrame for joining
other_data = {
    'Department': ['HR', 'IT', 'Marketing'],
    'Manager': ['M1', 'M2', 'M3']
}
df2 = pd.DataFrame(other_data)

# Perform left join, right join, inner join, and outer join
left_join = pd.merge(df, df2, on='Department', how='left')
right_join = pd.merge(df, df2, on='Department', how='right')
inner_join = pd.merge(df, df2, on='Department', how='inner')
outer_join = pd.merge(df, df2, on='Department', how='outer')

# Compute the rolling mean of the 'Income' column
df['RollingMeanIncome'] = df['Income'].rolling(window=2).mean()

# Convert the DataFrame to a NumPy array
numpy_array = df.to_numpy()

# Extract unique values from the 'Department' column and create a new DataFrame
unique_departments = pd.unique(df['Department'])
unique_df = pd.DataFrame({'UniqueDepartments': unique_departments})

# Create a cross-tabulation table from two columns
cross_tab = pd.crosstab(df['Department'], df['YearsOld'])

# Normalize values in the 'YearsOld' column using z-score
mean_age = df['YearsOld'].mean()
std_dev_age = df['YearsOld'].std()
df['AgeZScore'] = (df['YearsOld'] - mean_age) / std_dev_age

# Display the DataFrames and results
print("Original DataFrame:")
print(df)

print("\nMelted DataFrame:")
print(melted_df)

print("\nRenamed DataFrame:")
print(df)

print("\nCorrelation between 'YearsOld' and 'Income':", correlation)

print("\nString Operations on 'Name' column:")
print(df[['Name', 'NameLength']])

print("\nDate and Time Operations on 'JoinDate' column:")
print(df[['JoinDate', 'YearsSinceJoining']])

print("\nFiltered DataFrame:")
print(filtered_df)

print("\nLeft Join:")
print(left_join)

print("\nRight Join:")
print(right_join)

print("\nInner Join:")
print(inner_join)

print("\nOuter Join:")
print(outer_join)

print("\nRolling Mean of 'Income' column:")
print(df[['Income', 'RollingMeanIncome']])

print("\nDataFrame to NumPy Array:")
print(numpy_array)

print("\nUnique Departments DataFrame:")
print(unique_df)

print("\nCross-Tabulation Table:")
print(cross_tab)

print("\nNormalized 'Age' (Z-Score):")
print(df[['YearsOld', 'AgeZScore']])
Machine Learning
NumPy and Pandas for Machine Learning
NumPy Questions
Create a NumPy array from a Python list
Certainly! NumPy is a popular library in Python for numerical computations, and it provides powerful tools for working with arrays. Here's how you can create a NumPy array from a Python list:
import numpy as np

# Creating a Python list
python_list = [1, 2, 3, 4, 5]

# Creating a NumPy array from the Python list
numpy_array = np.array(python_list)

print(numpy_array)
In this example, we first import the numpy module as np. Then, we create a Python list called python_list containing some integer values. Finally, we create a NumPy array called numpy_array using the np.array() function, which takes the Python list as an argument. The resulting NumPy array will have the same values as the original Python list.
Output:
[1 2 3 4 5]
Keep in mind that NumPy arrays are homogeneous, meaning they can only hold elements of a single data type. If the Python list contains mixed data types, NumPy will try to convert them to a common data type.
Find the mean, median, and standard deviation of a NumPy array
.
NumPy array:
import numpy as np

# Creating a NumPy array
numpy_array = np.array([12, 15, 18, 22, 25, 30, 35, 40, 45, 50])

# Calculating the mean
mean = np.mean(numpy_array)

# Calculating the median
median = np.median(numpy_array)

# Calculating the standard deviation
std_dev = np.std(numpy_array)

print("Mean:", mean)
print("Median:", median)
print("Standard Deviation:", std_dev)
In this example, we first create a NumPy array called numpy_array containing some integer values. Then, we use the NumPy functions np.mean(), np.median(), and np.std() to calculate the mean, median, and standard deviation of the array, respectively. Finally, we print out the results.
Output:
Mean: 30.2
Median: 27.5
Standard Deviation: 14.594519519326424
The mean is the average of all the values in the array, the median is the middle value when the values are sorted, and the standard deviation measures the spread or dispersion of the values around the mean.
Perform element-wise addition, subtraction, multiplication, and division of two arrays
import numpy as np

# Creating two NumPy arrays
array1 = np.array([1, 2, 3, 4, 5])
array2 = np.array([10, 20, 30, 40, 50])

# Element-wise addition
addition_result = array1 + array2

# Element-wise subtraction
subtraction_result = array1 - array2

# Element-wise multiplication
multiplication_result = array1 * array2

# Element-wise division
division_result = array2 / array1

print("Array1:", array1)
print("Array2:", array2)
print("Addition Result:", addition_result)
print("Subtraction Result:", subtraction_result)
print("Multiplication Result:", multiplication_result)
print("Division Result:", division_result)
In this example, we first create two NumPy arrays, array1 and array2, containing some integer values. Then, we perform the desired element-wise operations using the basic arithmetic operators (+, -, *, /). Finally, we print out the original arrays as well as the results of the operations.
Output:
Array1: [1 2 3 4 5]
Array2: [10 20 30 40 50]
Addition Result: [11 22 33 44 55]
Subtraction Result: [ -9 -18 -27 -36 -45]
Multiplication Result: [ 10  40  90 160 250]
Division Result: [10. 10. 10. 10. 10.]
Keep in mind that for these element-wise operations, the arrays should have the same shape or be broadcastable to the same shape.
Reshape a 1D array into a 2D array
import numpy as np

# Creating a 1D array
array_1d = np.array([1, 2, 3, 4, 5, 6])

# Reshaping the 1D array into a 2D array with 2 rows and 3 columns
array_2d = array_1d.reshape(2, 3)

print("Original 1D array:")
print(array_1d)

print("\nReshaped 2D array:")
print(array_2d)
In this example, we first create a 1D NumPy array called array_1d. Then, we use the reshape() function to convert it into a 2D array with 2 rows and 3 columns, resulting in an array where the elements are arranged in the new shape.
Output:
Original 1D array:
[1 2 3 4 5 6]

Reshaped 2D array:
[[1 2 3]
 [4 5 6]]
Extract even and odd elements from a NumPy array
import numpy as np

# Create a NumPy array
arr = np.array([1, 2, 3, 4, 5, 6, 7, 8, 9, 10])

# Extract even elements using boolean indexing
even_elements = arr[arr % 2 == 0]

# Extract odd elements using boolean indexing
odd_elements = arr[arr % 2 != 0]

print("Original Array:", arr)
print("Even Elements:", even_elements)
print("Odd Elements:", odd_elements)
Output:
Original Array: [ 1  2  3  4  5  6  7  8  9 10]
Even Elements: [ 2  4  6  8 10]
Odd Elements: [1 3 5 7 9]
In this example, we first create a NumPy array arr containing numbers from 1 to 10. Then, we use boolean indexing to extract even and odd elements into separate arrays even_elements and odd_elements.
Remember that this approach assumes you have a 1-dimensional array. If you have a multi-dimensional array and want to extract elements based on their position, you would need to adjust the indexing accordingly.
Create an identity matrix using NumPy
An identity matrix is a square matrix in which all the diagonal elements are 1 and all other elements are 0. In NumPy, you can create an identity matrix using the numpy.identity() function or the numpy.eye() function. Here are examples of both methods:
Using numpy.identity():
import numpy as np

# Create a 3x3 identity matrix
identity_matrix = np.identity(3)

print("Identity Matrix:")
print(identity_matrix)
Output:
Identity Matrix:
[[1. 0. 0.]
 [0. 1. 0.]
 [0. 0. 1.]]
Using numpy.eye():
import numpy as np

# Create a 4x4 identity matrix
identity_matrix = np.eye(4)

print("Identity Matrix:")
print(identity_matrix)
Output:
Identity Matrix:
[[1. 0. 0. 0.]
 [0. 1. 0. 0.]
 [0. 0. 1. 0.]
 [0. 0. 0. 1.]]
In both examples,
we use NumPy's functions to create identity matrices of different sizes (3x3 and 4x4). The numpy.identity(n) function directly creates an identity matrix of size n x n, while the numpy.eye(n) function can create identity matrices as well, but it allows you to specify additional parameters to control the position of the ones (diagonal) and the offset of the diagonal if needed.
Find the index of the maximum and minimum value in an array
You can use the numpy.argmax() and numpy.argmin() functions to find the indices of the maximum and minimum values in a NumPy array, respectively. Here are examples for both scenarios:
import numpy as np

# Create a NumPy array
arr = np.array([10, 5, 20, 15, 8, 25])

# Find the index of the maximum value
max_index = np.argmax(arr)

# Find the index of the minimum value
min_index = np.argmin(arr)

print("Array:", arr)
print("Index of Maximum Value:", max_index)
print("Index of Minimum Value:", min_index)
Output:
Array: [10  5 20 15  8 25]
Index of Maximum Value: 5
Index of Minimum Value: 1
In this example, we create a NumPy array arr with some values. Then, we use np.argmax(arr) to find the index of the maximum value (25) in the array, which is 5, and np.argmin(arr) to find the index of the minimum value (5) in the array, which is 1.
Remember that if there are multiple occurrences of the maximum or minimum value, np.argmax() and np.argmin() will return the index of the first occurrence.
Normalize the values in an array to have a mean of 0 and standard deviation of 1
To normalize the values in an array to have a mean of 0 and a standard deviation of 1, you can use the Z-score normalization technique. The formula for Z-score normalization is:
z = (x - μ) / σ
Where:

z is the normalized value (Z-score)
x is the original value
μ is the mean of the data
σ is the standard deviation of the data
Here's how you can do this using NumPy, along with an example:
import numpy as np

# Create a NumPy array
data = np.array([10, 20, 30, 40, 50])

# Calculate mean and standard deviation
mean = np.mean(data)
std_dev = np.std(data)

# Normalize the array using Z-score normalization
normalized_data = (data - mean) / std_dev

print("Original Data:", data)
print("Normalized Data:", normalized_data)
Output:
Original Data: [10 20 30 40 50]
Normalized Data: [-1.41421356 -0.70710678  0.          0.70710678  1.41421356]
In this example, we create a NumPy array data with some values. Then, we calculate the mean and standard deviation of the data using np.mean() and np.std(). Finally, we normalize the data using the Z-score formula. The resulting normalized_data array has a mean of approximately 0 and a standard deviation of approximately 1.
Create a NumPy array with random values
.
There are various functions within this module that allow you to generate arrays with random values following different distributions. Here are a few examples:
Generating an array of random integers between a specified range:
import numpy as np

# Generate an array of 5 random integers between 0 and 10
random_integers = np.random.randint(0, 11, 5)

print("Random Integers:", random_integers)
Generating an array of random floating-point numbers from a uniform distribution between 0 and 1:
import numpy as np

# Generate an array of 5 random floats between 0 and 1
random_floats = np.random.rand(5)

print("Random Floats:", random_floats)
Generating an array of random numbers from a standard normal distribution (mean=0, std=1):
import numpy as np

# Generate an array of 5 random numbers from a standard normal distribution
random_normal = np.random.randn(5)

print("Random Normal:", random_normal)
Generating a random 2D array with specified dimensions:
import numpy as np

# Generate a 2x3 random array with numbers from a standard normal distribution
random_2d = np.random.randn(2, 3)


print("Random 2D Array:")
print(random_2d)
These are just a few examples of how you can create arrays with random values using NumPy's random module. You can explore more functions within numpy.random for different distribution types and customization options. Remember that random values are generated based on random seeds, so if you want reproducible results, consider setting a seed using numpy.random.seed().
Sort a NumPy array in ascending and descending order
Sorting in Ascending Order:
Using numpy.sort() function:
import numpy as np

# Create a NumPy array
arr = np.array([10, 5, 8, 15, 3])

# Sort the array in ascending order using numpy.sort()
sorted_arr = np.sort(arr)

print("Original Array:", arr)
print("Sorted Array (Ascending):", sorted_arr)
Using array's sort() method:
import numpy as np

# Create a NumPy array
arr = np.array([10, 5, 8, 15, 3])

# Sort the array in ascending order using the sort() method
arr.sort()

print("Original Array:", arr)
Sorting in Descending Order:
Using numpy.sort() function with the [::-1] slicing trick to reverse the sorted array:
import numpy as np

# Create a NumPy array
arr = np.array([10, 5, 8, 15, 3])

# Sort the array in ascending order using numpy.sort() and reverse the order
sorted_arr_desc = np.sort(arr)[::-1]

print("Original Array:", arr)
print("Sorted Array (Descending):", sorted_arr_desc)
Using array's sort() method with the [::-1] slicing trick:
import numpy as np

# Create a NumPy array
arr = np.array([10, 5, 8, 15, 3])

# Sort the array in ascending order using the sort() method and reverse the order
arr.sort()
arr_desc = arr[::-1]

print("Original Array:", arr)
print("Sorted Array (Descending):", arr_desc)
In all examples, we first create a NumPy array arr with some values. Then, we use either np.sort() or the array's .sort() method to sort the array. For descending order, we use the [::-1] slicing trick to reverse the sorted array.
Multiply two matrices using NumPy
You can multiply two matrices using the numpy.dot() function or the @ operator in Python when working with NumPy arrays. Here are examples of both methods:
Using numpy.dot() function:
import numpy as np

# Create two matrices
matrix1 = np.array([[1, 2],
                    [3, 4]])

matrix2 = np.array([[5, 6],
                    [7, 8]])

# Multiply the matrices using np.dot()
result = np.dot(matrix1, matrix2)

print("Matrix 1:")
print(matrix1)
print("\nMatrix 2:")
print(matrix2)
print("\nMatrix Multiplication Result:")
print(result)
Using @ operator:
import numpy as np

# Create two matrices
matrix1 = np.array([[1, 2],
                    [3, 4]])

matrix2 = np.array([[5, 6],
                    [7, 8]])

# Multiply the matrices using @ operator
result = matrix1 @ matrix2

print("Matrix 1:")
print(matrix1)
print("\nMatrix 2:")
print(matrix2)
print("\nMatrix Multiplication Result:")
print(result)
Output (for both examples):
Matrix 1:
[[1 2]
 [3 4]]

Matrix 2:
[[5 6]
 [7 8]]
Matrix Multiplication Result:
[[19 22]
 [43 50]]
In both examples, we create two 2x2 matrices matrix1 and matrix2. Then, we use either np.dot(matrix1, matrix2) or matrix1 @ matrix2 to perform matrix multiplication. The resulting result matrix is the product of the two matrices.
Matrix multiplication follows specific rules, and the number of columns in the first matrix must match the number of rows in the second matrix. The resulting matrix has dimensions (rows of matrix1) x (columns of matrix2).
Create a NumPy array with random values
The dot product of two arrays (vectors) can be calculated using the numpy.dot() function or the numpy.inner() function in NumPy. Here are examples of both methods:
Using numpy.dot() function:
import numpy as np

# Create two arrays (vectors)
vector1 = np.array([1, 2, 3])
vector2 = np.array([4, 5, 6])

# Calculate the dot product using np.dot()
dot_product = np.dot(vector1, vector2)

print("Vector 1:", vector1)
print("Vector 2:", vector2)
print("Dot Product:", dot_product)
Using numpy.inner() function:
import numpy as np

# Create two arrays (vectors)
vector1 = np.array([1, 2, 3])
vector2 = np.array([4, 5, 6])

# Calculate the dot product using np.inner()
dot_product = np.inner(vector1, vector2)

print("Vector 1:", vector1)
print("Vector 2:", vector2)
print("Dot Product:", dot_product)
Output (for both examples):
Vector 1: [1 2 3]
Vector 2: [4 5 6]
Dot Product: 32
Sort a NumPy array in ascending and descending order
You can sort a NumPy array in ascending and descending order using the numpy.sort() function and the array's sort() method. Here are examples for both scenarios:
Sorting in Ascending Order:
Using numpy.sort() function:
import numpy as np

# Create a NumPy array
arr = np.array([10, 5, 8, 15, 3])

# Sort the array in ascending order using numpy.sort()
sorted_arr = np.sort(arr)

print("Original Array:", arr)
print("Sorted Array (Ascending):", sorted_arr)
Using array's sort() method:
import numpy as np

# Create a NumPy array
arr = np.array([10, 5, 8, 15, 3])

# Sort the array in ascending order using the sort() method
arr.sort()

print("Original Array:", arr)
Sorting in Descending Order:
Using numpy.sort() function with the [::-1] slicing trick to reverse the sorted array:
import numpy as np

# Create a NumPy array
arr = np.array([10, 5, 8, 15, 3])

# Sort the array in ascending order using numpy.sort() and reverse the order
sorted_arr_desc = np.sort(arr)[::-1]

print("Original Array:", arr)
print("Sorted Array (Descending):", sorted_arr_desc)
Using array's sort() method with the [::-1] slicing trick:
import numpy as np

# Create a NumPy array
arr = np.array([10, 5, 8, 15, 3])

# Sort the array in ascending order using the sort() method and reverse the order
arr.sort()
arr_desc = arr[::-1]

print("Original Array:", arr)
print("Sorted Array (Descending):", arr_desc)
In all examples, we first create a NumPy array arr with some values. Then, we use either np.sort() or the array's .sort() method to sort the array. For descending order, we use the [::-1] slicing trick to reverse the sorted array.
Multiply two matrices using NumPy
Using numpy.dot() function:
import numpy as np

# Create two matrices
matrix1 = np.array([[1, 2],
                    [3, 4]])

matrix2 = np.array([[5, 6],
                    [7, 8]])

# Multiply the matrices using np.dot()
result = np.dot(matrix1, matrix2)

print("Matrix 1:")
print(matrix1)
print("\nMatrix 2:")
print(matrix2)
print("\nMatrix Multiplication Result:")
print(result)
Using @ operator:
import numpy as np

# Create two matrices
matrix1 = np.array([[1, 2],
                    [3, 4]])

matrix2 = np.array([[5, 6],
                    [7, 8]])

# Multiply the matrices using @ operator
result = matrix1 @ matrix2

print("Matrix 1:")
print(matrix1)
print("\nMatrix 2:")
print(matrix2)
print("\nMatrix Multiplication Result:")
print(result)
Output (for both examples):
Matrix 1:
[[1 2]
 [3 4]]

Matrix 2:
[[5 6]
 [7 8]]
Matrix Multiplication Result:
[[19 22]
 [43 50]]
In
both examples, we create two 2x2 matrices matrix1 and matrix2. Then, we use either np.dot(matrix1, matrix2) or matrix1 @ matrix2 to perform matrix multiplication. The resulting result matrix is the product of the two matrices.
Matrix multiplication follows specific rules, and the number of columns in the first matrix must match the number of rows in the second matrix. The resulting matrix has dimensions (rows of matrix1) x (columns of matrix2).
Find the dot product of two arrays
Using numpy.dot() function:
import numpy as np

# Create two arrays (vectors)
vector1 = np.array([1, 2, 3])
vector2 = np.array([4, 5, 6])

# Calculate the dot product using np.dot()
dot_product = np.dot(vector1, vector2)

print("Vector 1:", vector1)
print("Vector 2:", vector2)
print("Dot Product:", dot_product)
Using numpy.inner() function:
import numpy as np

# Create two arrays (vectors)
vector1 = np.array([1, 2, 3])
vector2 = np.array([4, 5, 6])

# Calculate the dot product using np.inner()
dot_product = np.inner(vector1, vector2)

print("Vector 1:", vector1)
print("Vector 2:", vector2)
print("Dot Product:", dot_product)
Output (for both examples):
Vector 1: [1 2 3]
Vector 2: [4 5 6]
Dot Product: 32
In both examples, we create two arrays (vectors) vector1 and vector2. Then, we use either np.dot(vector1, vector2) or np.inner(vector1, vector2) to calculate their dot product. The dot product is the sum of the element-wise multiplication of the corresponding elements of the two vectors.
Concatenate two arrays horizontally and vertically
Concatenating Horizontally:
Using numpy.concatenate():
import numpy as np

# Create two arrays
array1 = np.array([[1, 2],
                   [3, 4]])

array2 = np.array([[5, 6]])

# Concatenate horizontally using numpy.concatenate()
result = np.concatenate((array1, array2), axis=1)

print("Array 1:")
print(array1)
print("\nArray 2:")
print(array2)
print("\nHorizontally Concatenated Result:")
print(result)
Using numpy.hstack():
import numpy as np

# Create two arrays
array1 = np.array([[1, 2],
                   [3, 4]])

array2 = np.array([[5, 6]])

# Concatenate horizontally using numpy.hstack()
result = np.hstack((array1, array2))

print("Array 1:")
print(array1)
print("\nArray 2:")
print(array2)
print("\nHorizontally Concatenated Result:")
print(result)
Concatenating Vertically:
Using numpy.concatenate():
import numpy as np

# Create two arrays
array1 = np.array([[1, 2],
                   [3, 4]])

array2 = np.array([[5, 6]])

# Concatenate vertically using numpy.concatenate()
result = np.concatenate((array1, array2), axis=0)

print("Array 1:")
print(array1)
print("\nArray 2:")
print(array2)
print("\nVertically Concatenated Result:")
print(result)
Using numpy.vstack():
import numpy as np

# Create two arrays
array1 = np.array([[1, 2],
                   [3, 4]])

array2 = np.array([[5, 6]])

# Concatenate vertically using numpy.vstack()
result = np.vstack((array1, array2))

print("Array 1:")
print(array1)
print("\nArray 2:")
print(array2)
print("\nVertically Concatenated Result:")
print(result)
Output (for all examples):
Array 1:
[[1 2]
 [3 4]]

Array 2:
[[5 6]]

Horizontally Concatenated Result:
[[1 2 5 6]
 [3 4 5 6]]

Array 1:
[[1 2]
 [3 4]]

Array 2:
[[5 6]]

Horizontally Concatenated Result:
[[1 2 5 6]
 [3 4 5 6]]

Array 1:
[[1 2]
 [3 4]]

Array 2:
[[5 6]]

Vertically Concatenated Result:
[[1 2]
 [3 4]
 [5 6]]
In all examples, we create two arrays array1 and array2. Then, we use either np.concatenate(), np.vstack(), or np.hstack() to concatenate the arrays either horizontally or vertically. The axis parameter in np.concatenate() specifies whether to concatenate along rows (axis=0) or columns (axis=1). The np.vstack() function is specifically used for vertical stacking, while np.hstack() is used for horizontal stacking.
Perform element-wise comparisons between two arrays
You can perform element-wise comparisons between two arrays in NumPy using various comparison operators (such as ==, !=, <, >, <=, and >=). These operators return Boolean arrays indicating the result of the element-wise comparison. Here are examples demonstrating different element-wise comparisons:
import numpy as np

# Create two arrays
array1 = np.array([1, 2, 3, 4, 5])
array2 = np.array([3, 2, 1, 4, 4])

# Element-wise equality comparison
equality_comparison = array1 == array2

# Element-wise inequality comparison
inequality_comparison = array1 != array2

# Element-wise less than comparison
less_than_comparison = array1 < array2

# Element-wise greater than comparison
greater_than_comparison = array1 > array2

# Element-wise less than or equal to comparison
less_than_equal_comparison = array1 <= array2

# Element-wise greater than or equal to comparison
greater_than_equal_comparison = array1 >= array2

print("Array 1:", array1)
print("Array 2:", array2)
print("Equality Comparison:", equality_comparison)
print("Inequality Comparison:", inequality_comparison)
print("Less Than Comparison:", less_than_comparison)
print("Greater Than Comparison:", greater_than_comparison)
print("Less Than or Equal Comparison:", less_than_equal_comparison)
print("Greater Than or Equal Comparison:", greater_than_equal_comparison)
Output:
Array 1: [1 2 3 4 5]
Array 2: [3 2 1 4 4]
Equality Comparison: [False  True False  True False]
Inequality Comparison: [ True False  True False  True]
Less Than Comparison: [ True False False False False]
Greater Than Comparison: [False False  True False  True]
Less Than or Equal Comparison: [ True  True False  True False]
Greater Than or Equal Comparison: [False  True  True  True  True]
In this example, we create two arrays array1 and array2. Then, we perform element-wise comparisons using various operators. The resulting Boolean arrays show the result of each element-wise comparison.
Find the unique values and their counts in an array
You can find the unique values and their counts in a NumPy array using the numpy.unique() function. This function returns the sorted unique values and their respective counts. Here's an example:
import numpy as np

# Create an array with repeated and random values
array = np.array([1, 2, 2, 3, 4, 4, 4, 5, 5, 6, 6, 6])

# Find unique values and their counts using np.unique()
unique_values, unique_counts = np.unique(array, return_counts=True)

print("Array:", array)
print("Unique Values:", unique_values)
print("Counts:", unique_counts)
Output:
Array: [1 2 2 3 4 4 4 5 5 6 6 6]
Unique Values: [1 2 3 4 5 6]
Counts: [1 2 1 3 2 3]
In this example, we create an array array with repeated and random values. Then, we use np.unique(array, return_counts=True) to find the unique values and their corresponding counts. The return_counts=True argument ensures that the counts of each unique value are returned.
Replace all negative values in an array with zeros
Using numpy.clip() function:
import numpy as np

# Create an array with both positive and negative values
array = np.array([-1, 2, -3, 4, -5])

# Replace negative values with zeros using np.clip()
result = np.clip(array, a_min=0, a_max=None)

print("Original Array:", array)
print("Array with Negative Values Replaced:", result)
Output:
Original Array: [-1 2 -3 4 -5]
Array with Negative Values Replaced: [0 2 0 4 0]
In this example, we use np.clip(array, a_min=0, a_max=None) to replace negative values with zeros. The a_min parameter specifies the minimum value to clip to (which is 0 in this case), and a_max parameter is set to None to allow values to be clipped only from below.
Using boolean indexing:
import numpy as np

# Create an array with both positive and negative values
array = np.array([-1, 2, -3, 4, -5])

# Replace negative values with zeros using boolean indexing
array[array < 0] = 0

print("Original Array:", array)
Output:
Original Array: [0 2 0 4 0]
In this example, we use boolean indexing to identify negative values and replace them with zeros in the array.
Both methods achieve the same result, but the choice of method depends on your preference and the context of your code.
Create a NumPy array with evenly spaced values
import numpy as np

# Create an array with 10 evenly spaced values between 0 and 1 (inclusive)
evenly_spaced_array = np.linspace(0, 1, 10)

print("Evenly Spaced Array:", evenly_spaced_array)
Output:
Evenly Spaced Array: [0.         0.11111111 0.22222222 0.33333333 0.44444444 0.55555556
 0.66666667 0.77777778 0.88888889 1.        ]
In this example, np.linspace(0, 1, 10) generates an array with 10 evenly spaced values between 0 and 1, inclusive. The start and stop arguments specify the range of values, and the num argument specifies the number of values you want in the array.
If you want to generate values with a specific step size, you can use the numpy.arange() function. Here's an example:
import numpy as np

# Create an array with values starting from 0, incrementing by 0.2, up to 1 (exclusive)
evenly_spaced_array = np.arange(0, 1, 0.2)

print("Evenly Spaced Array:", evenly_spaced_array)
Output:
Evenly Spaced Array: [0. 0.2 0.4 0.6 0.8]
In this example, np.arange(0, 1, 0.2) generates an array with values starting from 0 and incrementing by 0.2, up to (but not including) 1. The start, stop, and step arguments control the range and spacing of values in the array.
Calculate the cumulative sum of an array
You can calculate the cumulative sum of an array in NumPy using the numpy.cumsum() function. This function returns an array of the cumulative sum of elements along a given axis. Here are examples with both 1D and 2D arrays:
Cumulative Sum of a 1D Array:

import numpy as np

# Create a 1D array
array = np.array([1, 2, 3, 4, 5])

# Calculate the cumulative sum using np.cumsum()
cumulative_sum = np.cumsum(array)

print("Original Array:", array)
print("Cumulative Sum Array:", cumulative_sum)
Output:
Original Array: [1 2 3 4 5]
Cumulative Sum Array: [ 1  3  6 10 15]
In this example, we create a 1D array array and then use np.cumsum(array) to calculate the cumulative sum of its elements.
Cumulative Sum of a 2D Array:
import numpy as np

# Create a 2D array
array = np.array([[1, 2, 3],
                  [4, 5, 6],
                  [7, 8, 9]])

# Calculate the cumulative sum along rows using np.cumsum()
cumulative_sum_rows = np.cumsum(array, axis=1)

# Calculate the cumulative sum along columns using np.cumsum()
cumulative_sum_columns = np.cumsum(array, axis=0)

print("Original 2D Array:")
print(array)
print("\nCumulative Sum along Rows:")
print(cumulative_sum_rows)
print("\nCumulative Sum along Columns:")
print(cumulative_sum_columns)
Output:
Original 2D Array:
[[1 2 3]
 [4 5 6]
 [7 8 9]]

Cumulative Sum along Rows:
[[ 1  3  6]
 [ 4  9 15]
 [ 7 15 24]]

Cumulative Sum along Columns:
[[ 1  2  3]
 [ 5  7  9]
 [12 15 18]]
In this example, we create a 2D array array and then use np.cumsum(array, axis=1) to calculate the cumulative sum along rows and np.cumsum(array, axis=0) to calculate the cumulative sum along columns. The resulting arrays show the cumulative sums along the specified axis.
Calculate the eigenvalues and eigenvectors of a matrix
.You can calculate the eigenvalues and eigenvectors of a matrix using the numpy.linalg.eig() function in NumPy. Here's an example:
import numpy as np

# Create a matrix
matrix = np.array([[3, -2],
                   [1,  0]])

# Calculate eigenvalues and eigenvectors using np.linalg.eig()
eigenvalues, eigenvectors = np.linalg.eig(matrix)

print("Matrix:")
print(matrix)
print("\nEigenvalues:", eigenvalues)
print("\nEigenvectors:")
print(eigenvectors)
Output:
Matrix:
[[ 3 -2]
 [ 1  0]]

Eigenvalues: [ 2.  1.]

Eigenvectors:
[[ 0.89442719  0.70710678]
 [ 0.4472136   0.70710678]]
In this example, we create a 2x2 matrix matrix. Then, we use np.linalg.eig(matrix) to calculate the eigenvalues and eigenvectors. The resulting eigenvalues array contains the eigenvalues of the matrix, and the eigenvectors matrix contains the corresponding eigenvectors as columns.
Find the index of the top N maximum values in an array
You can find the indices of the top N maximum values in a NumPy array using the numpy.argsort() function. This function returns the indices that would sort the array in ascending order. By using negative indexing, you can find the indices for the top N maximum values. Here's an example:
import numpy as np

# Create an array
array = np.array([10, 5, 8, 15, 3, 12, 7])

# Find the indices of the top 3 maximum values
n = 3
top_indices = np.argsort(-array)[:n]

print("Array:", array)
print("Indices of Top", n, "Maximum Values:", top_indices)
Output:
Array: [10  5  8 15  3 12  7]
Indices of Top 3 Maximum Values: [3 5 0]
In this example, we have an array array, and we want to find the indices of the top 3 maximum values. We use np.argsort(-array) to get the indices that would sort the array in descending order. Then, we use slicing [:n] to get the indices of the top N maximum values.
Pandas Questions
Read a CSV file into a pandas DataFrame
Sure, I can help you with that! To read a CSV file into a pandas DataFrame in Python, you'll need to use the pandas library. If you haven't already installed it, you can do so using the following command:
pip install pandas
Once you have pandas installed, you can use the read_csv() function to read the CSV file. Here's an example:
Suppose you have a CSV file named "data.csv" with the following content:
Name,Age,City
Alice,25,New York
Bob,30,San Francisco
Charlie,22,Los Angeles
You can read this CSV file into a pandas DataFrame like this:
import pandas as pd

# Read the CSV file into a DataFrame
df = pd.read_csv('data.csv')

# Display the DataFrame
print(df)
Output:
      Name  Age           City
0    Alice   25       New York
1      Bob   30  San Francisco
2  Charlie   22    Los Angeles
In this example, the read_csv() function reads the CSV file and creates a DataFrame with the data from the file. By default, the first row of the CSV file is treated as the header row, and column names are inferred from it.
You can also specify various options while reading the CSV file, such as specifying a custom delimiter, handling missing values, skipping rows, and more. Here's a slightly modified example that demonstrates some of these options:
import pandas as pd

# Read the CSV file into a DataFrame with custom options
df = pd.read_csv('data.csv', delimiter=',', skiprows=1, names=['Name', 'Age', 'Location'], na_values='NA')

# Display the DataFrame
print(df)
Output:
      Name  Age       Location
0    Alice   25       New York
1      Bob   30  San Francisco
2  Charlie   22    Los Angeles
In this example:
- We've specified a custom delimiter using the delimiter parameter.
- We're skipping the first row using the skiprows parameter.
- We've provided custom column names using the names parameter.
- We've specified 'NA' as the representation of missing values using the na_values parameter . Remember to adjust the file path ('data.csv' in the examples) according to the actual location of your CSV file.
Display the first few rows and last few rows of a DataFrame
you can use the head() method to display the first few rows of a DataFrame and the tail() method to display the last few rows. These methods are useful for quickly inspecting the contents of your DataFrame.
Here's how you can use them:
import pandas as pd

# Create a sample DataFrame
data = {'Name': ['Alice', 'Bob', 'Charlie', 'David', 'Emily'],
        'Age': [25, 30, 22, 28, 35],
        'City': ['New York', 'San Francisco', 'Los Angeles', 'Chicago', 'Boston']}

df = pd.DataFrame(data)

# Display the first 3 rows using head()
print("First few rows:")
print(df.head(3))  # You can specify the number of rows you want to display

# Display the last 2 rows using tail()
print("\nLast few rows:")
print(df.tail(2))  # You can specify the number of rows you want to display
Output:
First few rows:
      Name  Age           City
0    Alice   25       New York
1      Bob   30  San Francisco
2  Charlie   22    Los Angeles

Last few rows:
    Name  Age    City
3  David   28  Chicago
4  Emily   35  Boston
In this example:
We create a sample DataFrame called df.
- The head(3) method is used to display the first 3 rows of the DataFrame.
- The tail(2) method is used to display the last 2 rows of the DataFrame . You can adjust the number of rows you want to display by providing a different argument to the head() and tail() methods.
Select a specific column from a DataFrame
import pandas as pd
data = {'Name': ['Alice', 'Bob', 'Charlie'],
'Age': [25, 30, 22],
'City': ['New York', 'San Francisco', 'Los Angeles']}
df = pd.DataFrame(data)
Now, let's say you want to select the "Name" column from this DataFrame.
Using Square Bracket Notation:
You can use square brackets with the column name enclosed in quotes to select a specific column as a pandas Series:
python
Copy code
name_column = df['Name']
print(name_column)
Output:
0      Alice
1        Bob
2    Charlie
Name: Name, dtype: object
Using Dot Notation:
You can also use the dot notation to select a specific column, especially if the column name is a valid Python variable name (no spaces or special characters):
name_column = df.Name
print(name_column)
Output:
0      Alice
1        Bob
2    Charlie
Name: Name, dtype: object
Both of these methods will give you a pandas Series containing the values of the selected column. If you want the result as a DataFrame with just that column, you can use double square brackets:
name_column_df = df[['Name']]
print(name_column_df)
Output:
      Name
0    Alice
1      Bob
2  Charlie
Filter rows based on a condition
Suppose you have a DataFrame like this:
import pandas as pd

data = {'Name': ['Alice', 'Bob', 'Charlie', 'David', 'Emily'],
        'Age': [25, 30, 22, 28, 35],
        'City': ['New York', 'San Francisco', 'Los Angeles', 'Chicago', 'Boston']}

df = pd.DataFrame(data)
Let's say you want to filter out the rows where the age is greater than or equal to 30.
# Create a boolean mask based on the condition
mask = df['Age'] >= 30

# Apply the mask to filter the DataFrame
filtered_df = df[mask]

# Display the filtered DataFrame
print(filtered_df)
Output:
    Name  Age           City
1    Bob   30  San Francisco
4  Emily   35         Boston
In this example:
- We create a boolean mask mask by applying the condition df['Age'] >= 30.
- The mask has True values for rows that satisfy the condition and False values for rows that do not.
- By using this mask, we filter the DataFrame df, retaining only the rows where the condition is True.
- The result is the filtered_df DataFrame containing only the rows where the age is greater than or equal to 30 . You can combine multiple conditions using logical operators like & (and) and | (or). For example, if you want to filter rows where the age is greater than or equal to 30 and the city is either 'San Francisco' or 'Boston', you can do:
mask = (df['Age'] >= 30) & ((df['City'] == 'San Francisco') | (df['City'] == 'Boston'))
filtered_df = df[mask]
print(filtered_df)
Output:
    Name  Age           City
1    Bob   30  San Francisco
4  Emily   35         Boston
Remember to adjust the column names and conditions according to your specific filtering criteria.
Calculate summary statistics for a column (mean, median, etc.)
Suppose you have a DataFrame like this:
import pandas as pd
data = {'Name': ['Alice', 'Bob', 'Charlie', 'David', 'Emily'],
'Age': [25, 30, 22, 28, 35],
'Salary': [50000, 60000, 45000, 55000, 70000]}
df = pd.DataFrame(data)
- Mean:
You can calculate the mean of a column using the mean() function:
age_mean = df['Age'].mean()
print("Mean Age:", age_mean)
Output:
Mean Age: 28.0
- Median:
You can calculate the median of a column using the median() function:
salary_median = df['Salary'].median()
print("Median Salary:", salary_median)
Output:
Median Salary: 55000.0
- Minimum and Maximum:
You can calculate the minimum and maximum values of a column using the min() and max() functions:
min_age = df['Age'].min()
max_age = df['Age'].max()
print("Minimum Age:", min_age)
print("Maximum Age:", max_age)
Output:
Minimum Age: 22
Maximum Age: 35
4. Standard Deviation:
You can calculate the standard deviation of a column using the std() function:
salary_std = df['Salary'].std()
print("Salary Standard Deviation:", salary_std)
Output:
Salary Standard Deviation: 8774.812593090507
5. Count:
You can calculate the count of non-null values in a column using the count() function:
name_count = df['Name'].count()
print("Number of Names:", name_co
unt)
Output:
Number of Names: 5
These are just a few examples of the summary statistics you can calculate using pandas. There are many other statistical functions available in pandas to calculate various statistics based on your needs.
.
===========================================================
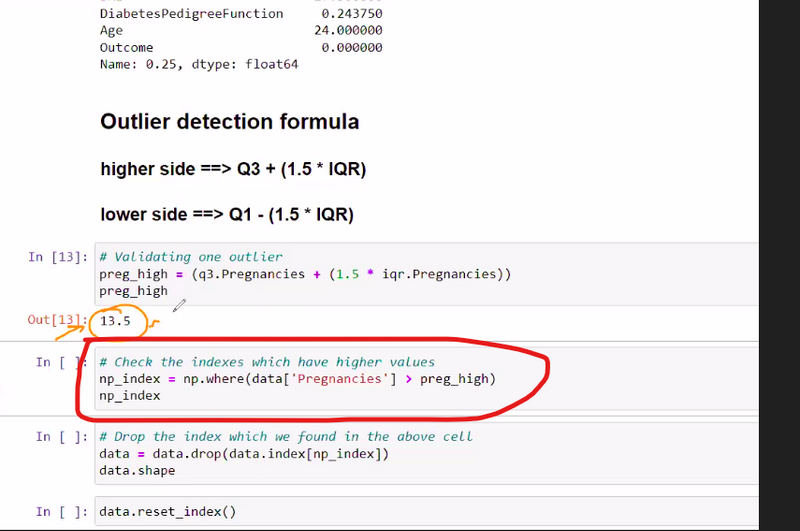
find the indices of elements in a NumPy array that are greater than a given threshold
import numpy as np

# Create a NumPy array
arr = np.array([12, 6, 18, 5, 8, 21, 15])

# Set the threshold
T = 10

# Use np.where to find indices of elements greater than the threshold
indices = np.where(arr > T)

# Print the indices and corresponding values
for i in indices[0]:
    print(f"Element at index {i} is greater than {T}: {arr[i]}")
output
Element at index 0 is greater than 10: 12
Element at index 2 is greater than 10: 18
Element at index 5 is greater than 10: 21
Element at index 6 is greater than 10: 15
=================================
replace all negative values with 0 and all positive values with 1
import numpy as np

# Create a NumPy array
x = np.array([-2, -1, 0, 1, 2, 3, -4, -5, 6])

# Use np.where to replace negative values with 0 and positive values with 1
result = np.where(x > 0, 1, 0)

# Print the resulting array
print(result)
output
[0 0 0 1 1 1 0 0 1]
==========================================
create a new array c such that c contains elements from a where the corresponding element in b is greater than 0,
# Create two NumPy arrays a and b
a = np.array([1, 2, 3, 4, 5])
b = np.array([0, -1, 2, -3, 0])

# Use np.where to create a new array c based on conditions
c = np.where(b > 0, a, b)

# Print the resulting array c
print(c)
output
[0 0 3 0 0]
import numpy as np

# Replace these with your data
data = {'Pregnancies': [1, 2, 3, 4, 5]}
preg_high = 3

# Find the indices of elements greater than preg_high
np_index = np.where(data['Pregnancies'] > preg_high)

# Print the results
print(np_index)
static variable
dynamic variable
example
Cheatsheet
numpy
arr = np.arange(10)
middle_elements = arr[1:-1]
numpy.max(array)
max_index = np.argmax(arr)
np.std(numpy_array)
mean = np.mean(data)
std_dev = np.std(data)
normalized_data = (data - mean) / std_dev
sorted_arr = np.sort(arr)
result = np.concatenate((array1, array2), axis=1)
pandas
filtered_data = data[data['Salary'] > 50000]
median_salary = data['Salary'].median()
grouped_data = data.groupby('Department')['Salary'].sum()
filled_data = data.fillna({'Salary': 0, 'Age': 30})
df['FullName'] = df['Name'] + ' (' + df['Department'] + ')'
df.rename(columns={'Age': 'YearsOld', 'Salary': 'Income'}, inplace=True)
// Applying the length function to create a new column 'NameLength
df['NameLength'] = df['Name'].apply(len)
df['JoinDate'] = pd.to_datetime(df['JoinDate'])
df['YearsSinceJoining'] = pd.to_datetime('today') - df['JoinDate']
df['YearsSinceJoining'] = df['YearsSinceJoining'].dt.days // 365
Short
numpy-create numpy array,skip first and last element of array, max,mean,std,normalized data,sorted,concatenate
pandas:-filtered,median,grouped,fill null value,create new col,rename,create new col length,joindate,yearsince joining

Top comments (0)