Data scientist and Machine learning Question
prompt engeeneering tips and tricks for Data scientist
Data scientist and Machine learning Question
What is NumPy? How does it facilitate numerical computing in Python? Provide examples of commonly used NumPy functions.
What is pandas? How does it facilitate data manipulation and analysis in Python? Provide examples of commonly used pandas functions.
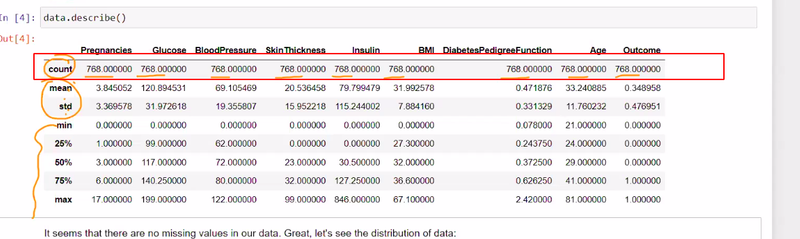
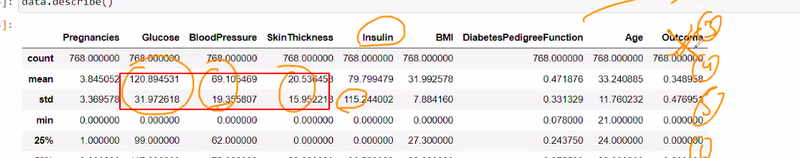
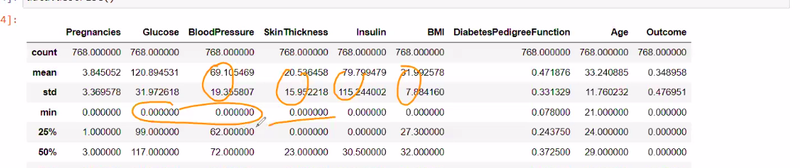
Explain the concept of data cleaning and preprocessing in the context of data science. Share some techniques and libraries in Python for handling missing values and outliers.
What is scikit-learn? How does it support machine learning tasks in Python? Provide examples of commonly used scikit-learn functions and algorithms.
What is the difference between supervised and unsupervised learning? Provide examples of each type and explain how Python can be used for implementation.
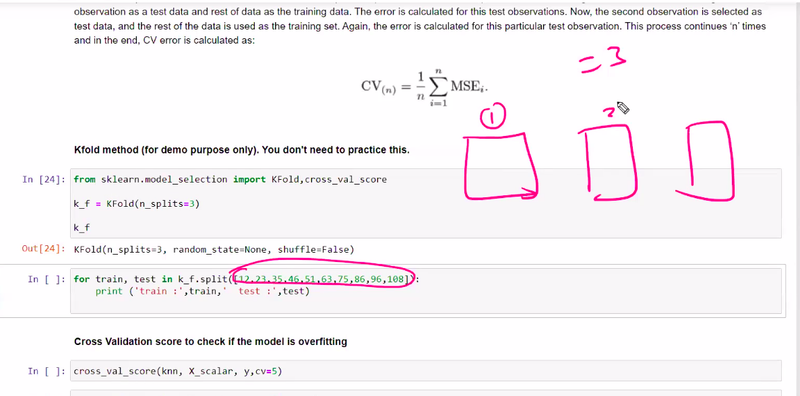
What are cross-validation techniques, and why are they important in machine learning? Explain how to perform cross-validation using Python libraries.
Describe your experience with feature selection and dimensionality reduction in machine learning. Share examples of techniques and Python libraries you have used.
Explain the concept of regularization in machine learning. How does it address overfitting, and what are commonly used regularization techniques in Python?
What is deep learning, and how does it differ from traditional machine learning? Describe your experience with deep learning frameworks in Python, such as TensorFlow or PyTorch.
How do you handle imbalanced datasets in machine learning? Share techniques and Python libraries you have used to address this issue.
Explain the concept of ensemble learning. What are commonly used ensemble methods, and how can they be implemented in Python?
What is natural language processing (NLP), and how does Python support NLP tasks? Describe your experience with NLP libraries, such as NLTK or spaCy.
Share an example of a data science or machine learning project you have worked on in Python. Discuss the problem statement, data preprocessing, modeling, and evaluation techniques used.
difference between structure and unstructured data in nlp
explain root cause analysis
what paramerter use in hyperparameter tuning in decision tree
explain dfference between decision tree and random forest
explain word to make in nlp
explain baggging and boosting
explain reinforcement learning
Machine Learning Interview Question
r2_score===================
radio,tv,newspaper
find r2 combinedly
find r2 seprately
standard deviatin== as small as then it goood for ml
quartile=25%,50%,75%
standard deviation should be high or less for good machine learning
Small
For categorical not continouus mean or mode used not float
mode
when mode take and means to fill nan
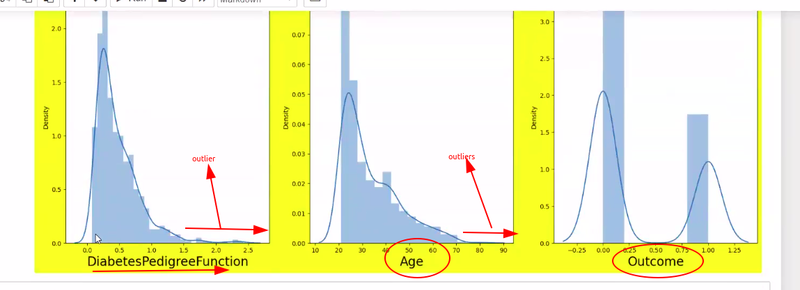
use dist plot to know normally distributed are not
find linnear relationship to know they are linearly dependent or not
why use standadization scale
to make equual bigger value  to bring unit variance
transform the features of a dataset to have zero mean and unit variance, making them comparable and preventing features with larger scales
for features not for target y
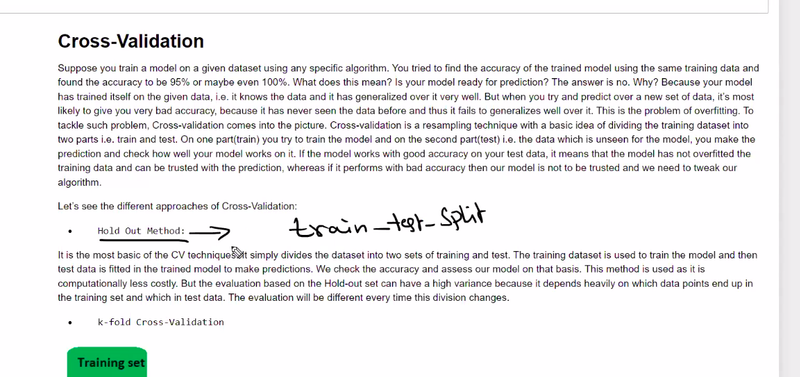
trained and test explain with example
order of train and test
np.random.seed equal random_statepredict of chance of admission using scalar transform
save the model using pickle
how to read pickle data
regression_score== how much u understand train training and test data(r adjusted score)
predict answer regression_predict
plot the data to know how x test and ay ped by scatter and draw linearly regression
model evaluation
IF u have to ignore outlier within linearly plotted
mean square errormen squared error
if new set of data then my trained model cannot predict is called overfitting
to check overfitting== lasso,ridge model
lsso== zero importance to unrelavant features
ridge-- sime importance
learning rate for lasso and ridge
cross validate== 10 times read/validate
lasso== max-iteration
when lsso and ridge model is to be used
np.arrange when use
logistic regression is used for what kind of data
categorical==true/false pass/fail  for classification
sigmoid== classify below some falue
evaluation of classifiction model
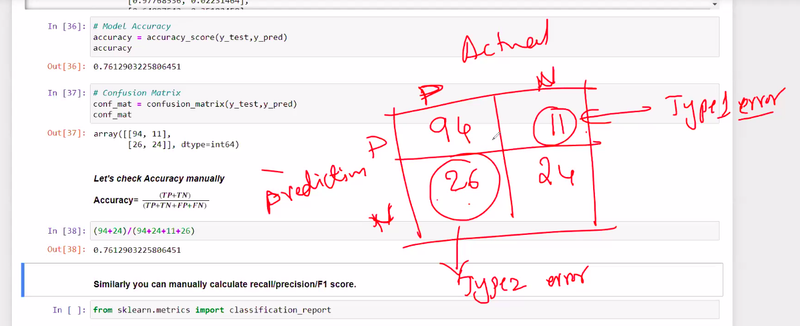
confusion matrix is used for categorical/classification or continous data
categorical/classification
logistic regression
Confusion matrix is used for only calssification model for lositic not for linear regression
corona actual and corona prediction
positive and negative
Which is more dangerous type-1 error or type-II
type 2 is more dangerous
precision recall accuracy
Based on recall value how you determine model is trained good
recall should be high
when minimizing false negatives is important
or when the cost of false negatives is high
In which case precision should be considered for good trained model
minimizing false positives is important or
 when the cost of false positives is high
.
Which Model Evaluation best to pick some part of both recall and precision and based on analysis determine prediction
F1 score
If threshold value change is all metric confusion matrix fl score, mean absolute error would be affected
Yes
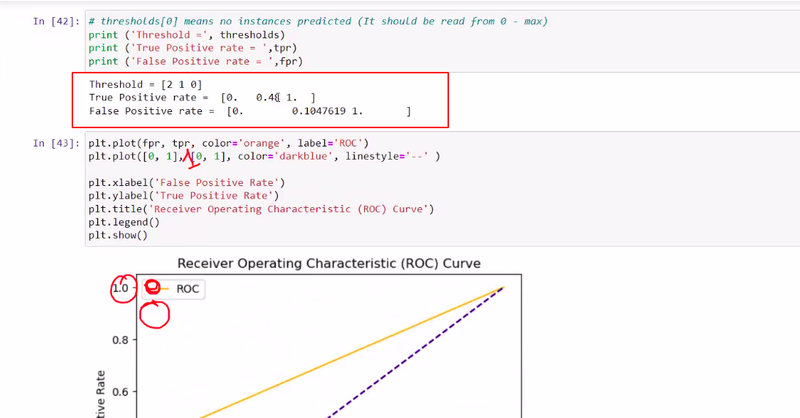
Which Model Evaluation best to pick best trained model out of 5 or 6 model
ROC curve
To accurate prediction dataset should have more or less data
More
What is alpha
error rate allowed
balancing between the model's complexity and its ability to fit the training data.
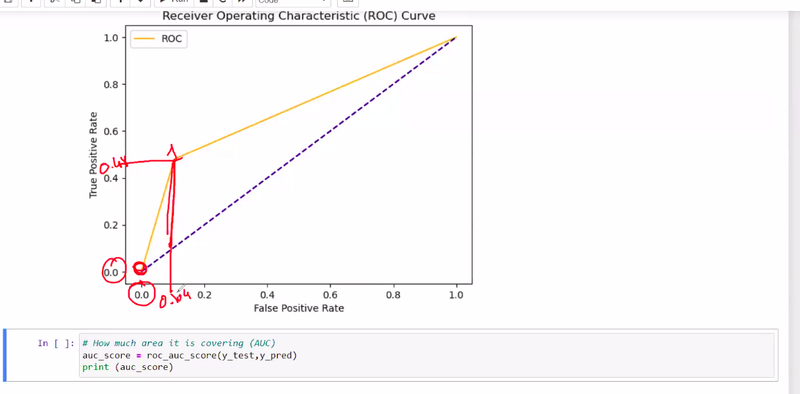
More curved under roc in ml determine
model's predictions are more accurate and reliable.
model has a higher discriminatory power and is able to distinguish between the positive and negative classes more effectively
np.arrange(0, 10, 2)
will create an array with values [0, 2, 4, 6, 8]
Logistic regression method
during data preprocessing == if u found any problem to find and treating outlier then again start data cleaning
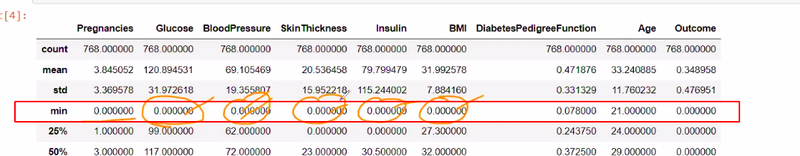
Different way to replace the zero in dataset
Mean/Median Imputation:
Mode Imputation:
Custom Value Imputation
Interpolation:
K-Nearest Neighbors (KNN) Imputation
Predictive Modeling
Zero-Filling for Sparsity
replace the zero with meaning full information like mean
If there is no difference between Q1 and Q3 meaning
data analysis is not good
we need data preprocessing those features
why normally distribution of data is important
beneficial in statistical modeling and inference.
very helpful to determine dependency between target  and features
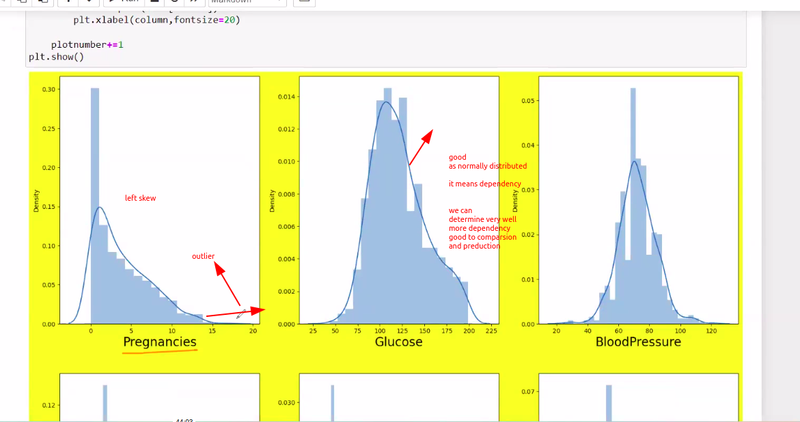
plotted data contain left and right skew indicates
more no of outlier present

how to identify which outlier we have to keep and which outlier have to drop
required domain knowledge
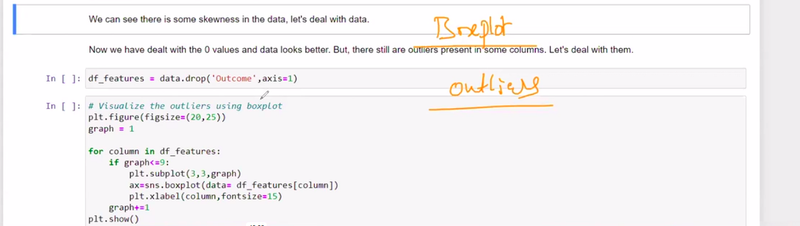
which visualization technique is good for determine outliers
boxplot
stripeplots
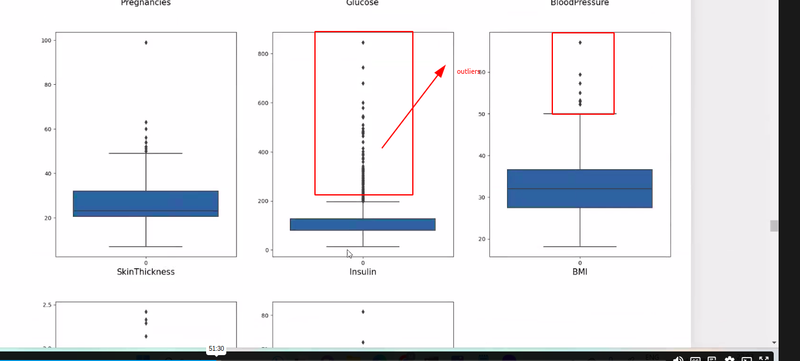
what formulla is uset to determine outliers
Quartile detection formulla
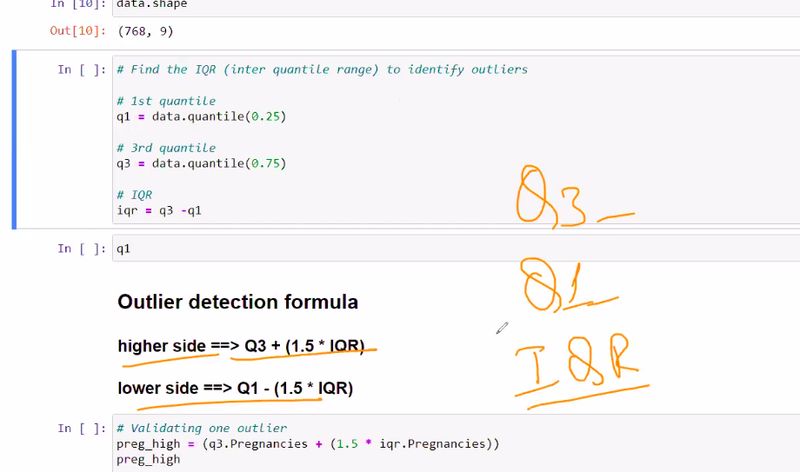
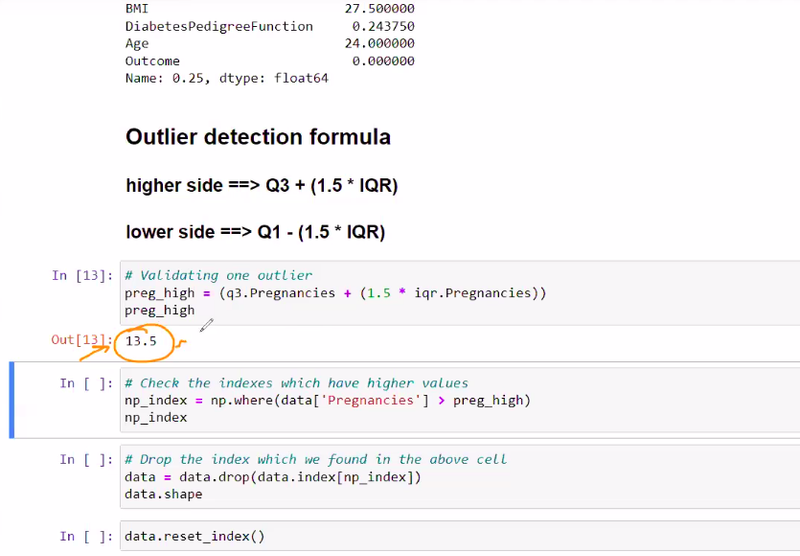
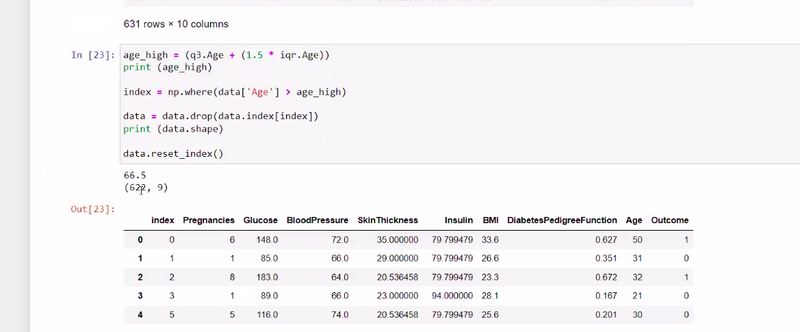
what are the steps to remove outliers
formulla outlier==
numpywherecondition ===
droping===
reset index
If height of bar is empty or very less in normal distributed data
sign of more outlier present
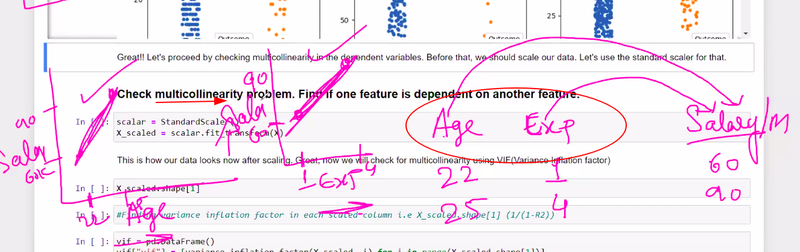
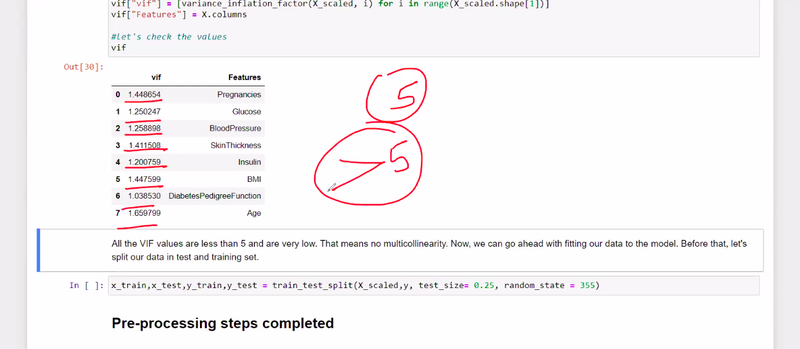
how to solve multicolinearity problem
VIF variance influence factor
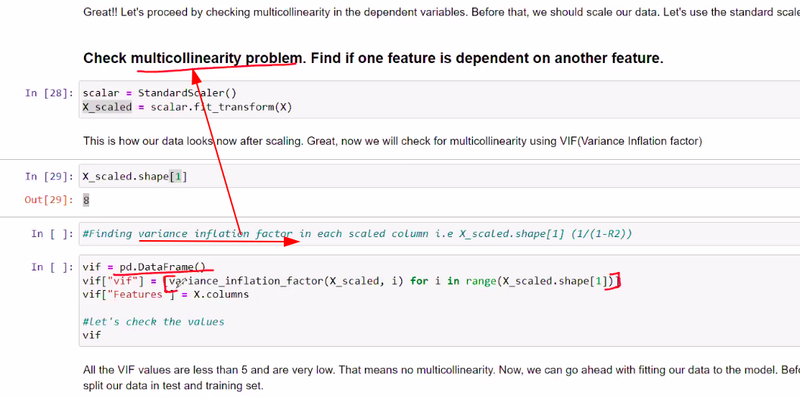
what value indicates variance inflation factor very less
less than 5
which model evalution is very helpful to determine true positive rate or false positive rate or tyoe 1 error or type 2 error
confusion matrix
roc curve
no difference between quartile of 25 % or 50 %if same then something wrong
draw the plots of all feature if it is distributed normally it is correct data but it has left skew then many outlier present
how to identify outlier then domain knowledge comes to very important role
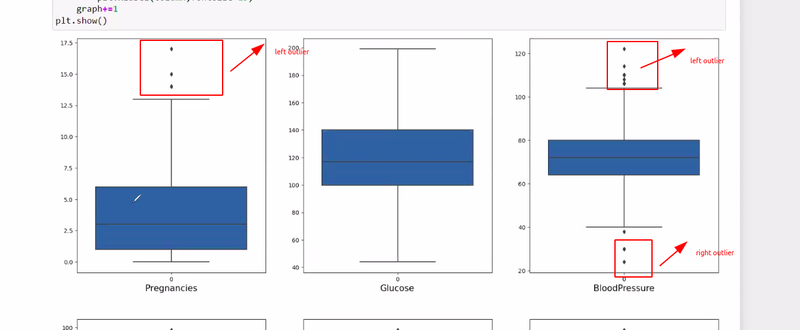
boxplot helps to determine outliers **
**in boxplot= outlier identify by no of dots otherwise in normal distribution height of bar is very less means outlier
in boxplot we can identfy outlier are in leftskew or rightskew
situation arises where we need to keep outlier and where we need to remove outlier by domain knowledge like in bank balance we need to keep outlier
outlier can be determine by quartile detection formulla
get outlier using numpy where condition
after determining outlier drop that data where u outlier found
after deleting outlier reset index
formulla outlier==
numpywherecondition ===
droping===
reset index
still outlier after deleting we can keep that data not harmfull for analysis
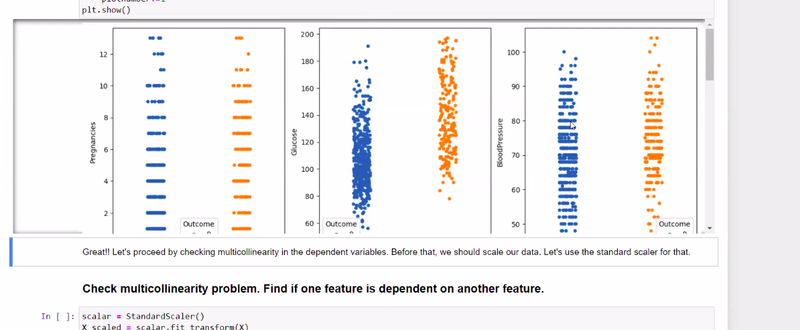
keep those feature where we have relationship with labels by stripe plot== label and features
in stripe plot if x increases then y also increses
after analysing x and y axis dependency we find that analysis
how to solve multicolinearity problem one feature dependent on another feature , salary dependent by age and exp that comes ur VIF variance influence factor
finding VIF in each scaled colunm by using forloop range in python
if all vif are less than 5 very lowthen no multicolinearity relation ship
model prdiction by 0 and 1
roc curve determine true and false positive rate
determine how much area covered by aoc
======================================================
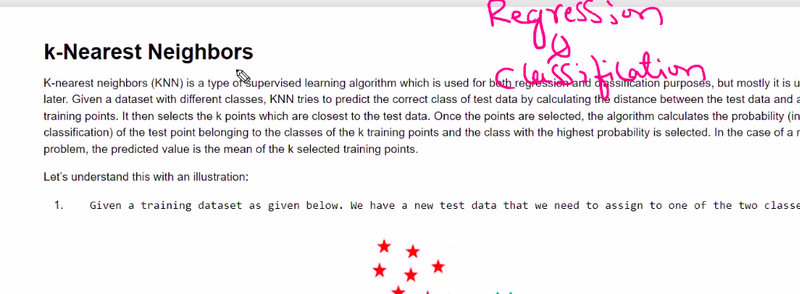
KNN/OVERFIITING/UNDERFITTING/BIAS TRADE OFF/VARIANCE
knn is used for regression or classification
both

knn mostly used for regression or classification
classification
*On what basis k value select in knn *
F1 score
cross validation
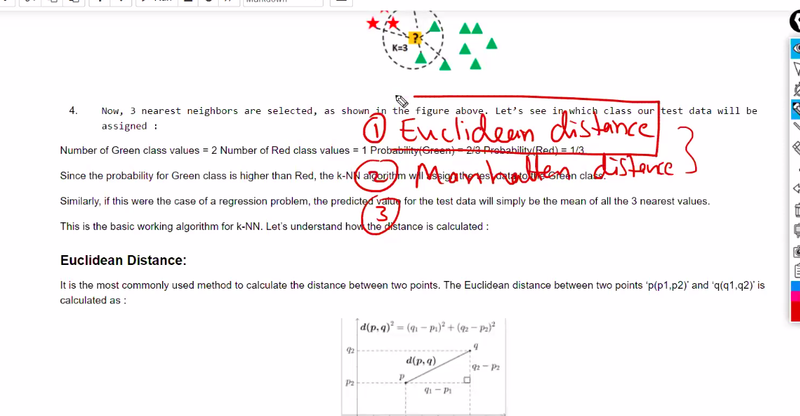
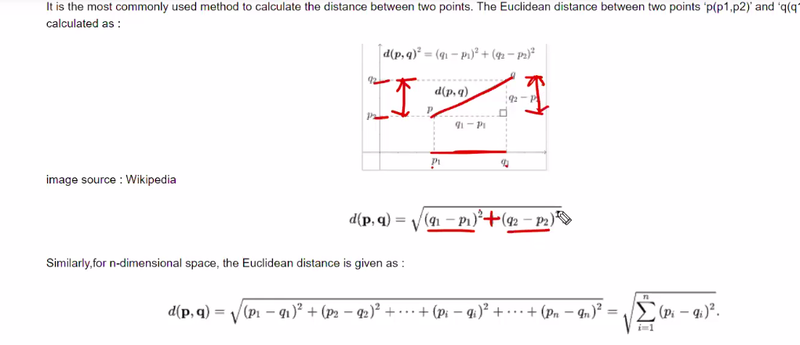
what are the method to find distance between data set and k value
Euclidean Distance
knn is supervised or unsupervised learning
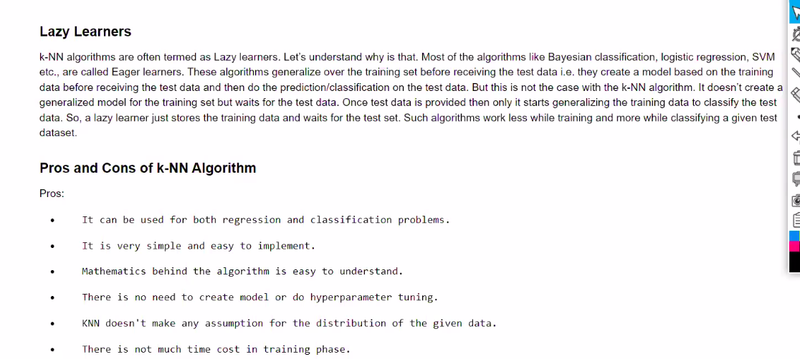
why knn is lazy learners
lazy learners are instance-based algorithms
memorize the entire training dataset and
make predictions for new data points based on
similarity to the existing data instances.
When knn should apply for which data set
well-suited for smaller datasets with
well-defined local structures and
non-linear decision boundaries
Most of the model used for preprocessing technique
sk learn
when data set imbalanced
distribution of class labels is not equal,
more instances of one class compared to the other(s).
Imbalanced dataset leads to overfitting or underfitting
Underfittings
Imbalanced dataset leads to bias or variance
bias
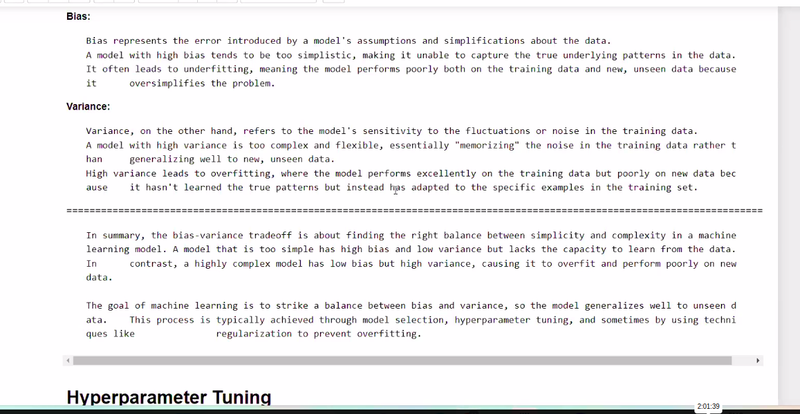
what is bais
model is too simple to capture  patterns and relationships
new, unseen data (test data)

fluctuations in the training data and noise and random variations in the training data leads to ?
variance and overfitting
what is the multicolinearity porpose
purpose to find best features
A high-bias model tends to have low variance but high bias, leading
underfitting
A high-variance model tends to have low bias but high variance
overfitting
what are the method to balance between bais and variance or underfitting or over fitting
bais trade off
What are the method to remove bais and variance
Cross-Validation:
Regularization:
k fold
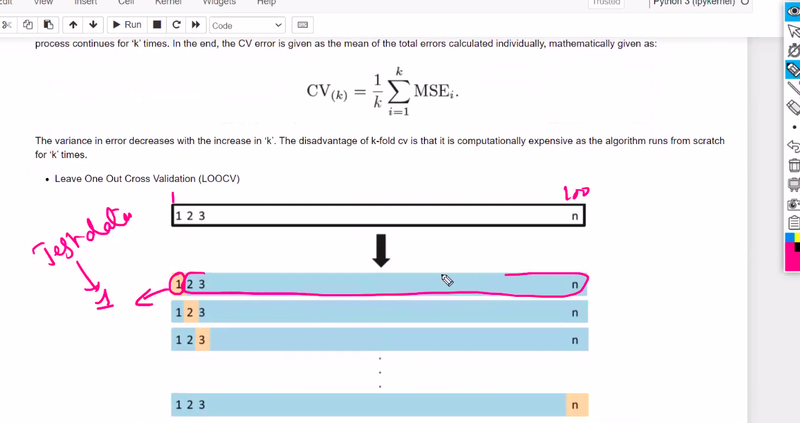
leave on out of cross validation
k fold cross validation
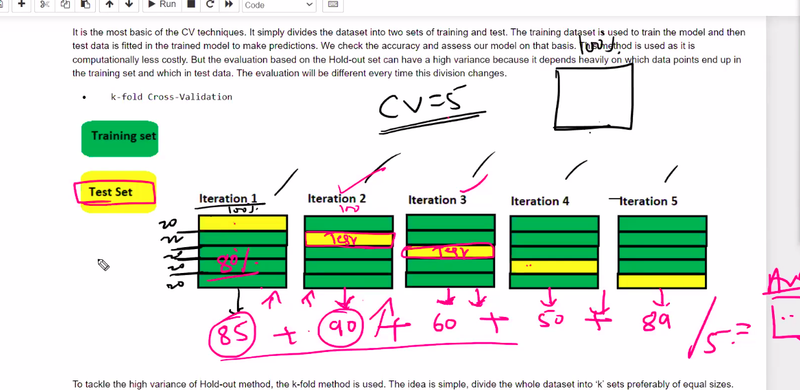
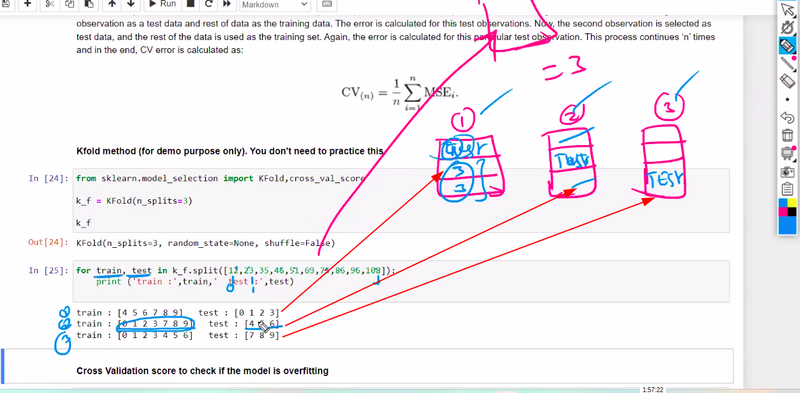
what is k fold cross validation
the dataset is divided into k equal-sized folds
trained on k-1 folds and validated on the remaining one
repeated k times,
what is leave on out of cross validation
unbiased estimate of the model's performance
what is Hyperparameter tuning
 avoid overfitting and underfitting
performs well on a wide range of datasets
computationally expensive and time-consuming,
what is brute force methods
all possible combinations of hyperparameter values within a predefined range to find the best set of hyperparameters
Methods of hyperparameter tunning
Grid Search
Randomized search
Bayesian Optimization
Genetic Algorithms
Gradient-based Optimization
what is encoder
that compresses and converts input data into a lower-dimensional representation like binary digit that ml understand
what is ohe
represents categorical variables as binary vectors
and encoder compact numerical representations of categorical variables
what is simple imputter
replaces missing values in a dataset with statistics
by default simple imputter is use
mean
Difference between si and fillna
replaces missing values in a dataset with statistics
fills missing values with specified values
Difference between ordinal encoder and label encoder
Ordinal encoder assigns integer values to ordinal categorical variables based on their order, while label encoder assigns unique integers to non-ordinal categorical variables in an arbitrary manner
what is get_dummies
get_dummies is a function used in pandas to convert categorical variables into dummy/indicator variables for machine learning
========================================================
when binary encoder used
large number of unique categories. or more than 5 category
when ohe used
number of unique categories is not very large less than 5 category to be used
When KNNImputer to be used
The KNNImputer replaces missing values in a dataset using the k-Nearest Neighbors approach
When Iterative-Imputer to be used
uses an iterative procedure to estimate the missing values based on other features
In data scintist lifecycle when data selection to be used
ignore nominal data like first name,sir name senior ,junior not used for analysis
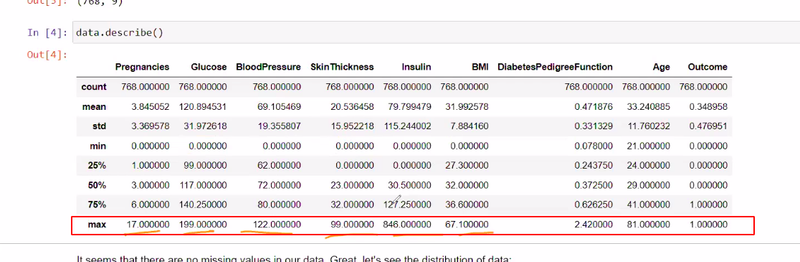
In data scintist lifecycle when data describe to be used
see mean,null,empty,quartile ,standard deviation all thing observe
In data scintist lifecycle when data data analysis to be used
normal distribution,box plot ,skew,outlier,bais,variance,bar plot left and right skew,check relationship
In data scintist lifecycle when data data transformation to be used
ctegorical transformation,encoding technique
In data scintist lifecycle selection ML algorithms
wheather it is classification,regression prob for catrgorical
multi classs ==then decision tree
In data scintist lifecycle data standard and normalization
standard scalar not baised unitless
When decision tree to be used
regression and classification both best algorithm to deal complex dataset and for multicalss for classification most of time dt
how to calculate most important feature to calculate considerd as root node
using tree prunning or gini index
when treeprunning to be used
when u want to go go decision quickly then cut tree
what is entropy
how much information every feature have label which feture higest feature is comes under root node
what is gini index
how much every feature have impurity less impurity better feature
id3--
What is CART
classification and regressssion and both datatype
by default we use gini index or entropy
gini index
When heatmap to be used
heat map use to find multicolinearty relationship
In metric score function, if train value is true
feature is selected for training
What visualization technique is selected to show multicolinearity
heatmap and scatterplot
IF testing accuracy is very less or huge difference between training accuracy and testing accuracy
we need to improve testing accuracy
when we stop to splitting decision tree
when 1 leaf node rhat is pure node
what is cv
cv increse training time
what are the method to tune the parameter in hyperparameter tunning
entropy,gini index
what are the ensamble approach
bagging and boosting
what are the boosting method
adaboost,gradient boosting,xtreme boosting
When we want to more than 2 or 3 model then we use
ensamble approach
why we use ensamble approach
take decision based on 100 DT models not one DT
one DT take some feature random ly so model is not baised very less chance baised
Advantage of bagging method
very less risk,safe model but time,cost budget issue
what is out of bag evalution
some testing feature out of bag/dataset for all MODEl
what is pasting
pasting once the feature selected for first DT then it is not allowed for second DT,3rd dt ==bootstrap false and without replacement
relation ship between features
multicolinearity
bagging and boosting performed operation
bagging==parallely

boosting==sequencially
By default random forest use
decision tree
knn is supervised is both for regression(like linear) and classification(logistic)
mainly used for classification
k is random variable
pass ed test data
calculated distatince b/w test data and all training data setif i mentio k=3 find 3 nearest neighbour data points that is closest
how many green or red products covered has highest probability
deciding to challange what is value of k
how to calculate distance
=technique
by eucadian we calculate sum of distance
lazy learner== some of students are lazy learners
when exam announced then stared to prepare
whenever r ready to train test then predict waits for test data
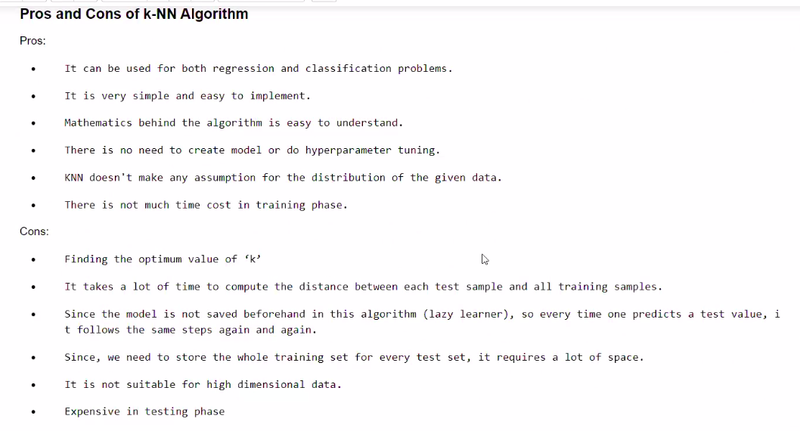
knn is not best when too many data in dataset difficult to find som of distance
all the model for preprocessing steps use==sklearn
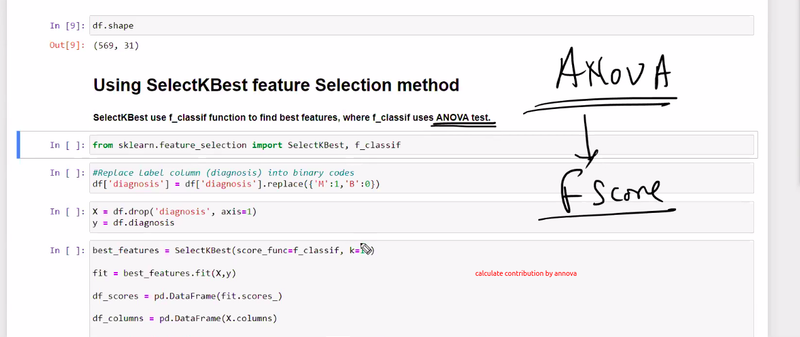
by which command we find data type of dataset
df.shape
classification== mcancer and b cancer
check dataset is imbalnced diference between m and b
bias= if imbalanced means then it predict only one thing m cancer type it is called bias
if model is bias then it is underfitting
multicolinaert== purpose to find best features
which feature contribute highest== by annova test
ml never understand object data type it inderstand 0 and 1
how to trained the mode on google cloud not in local
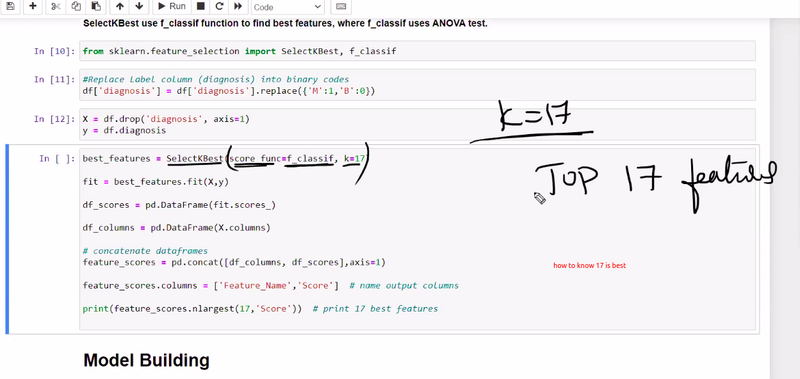
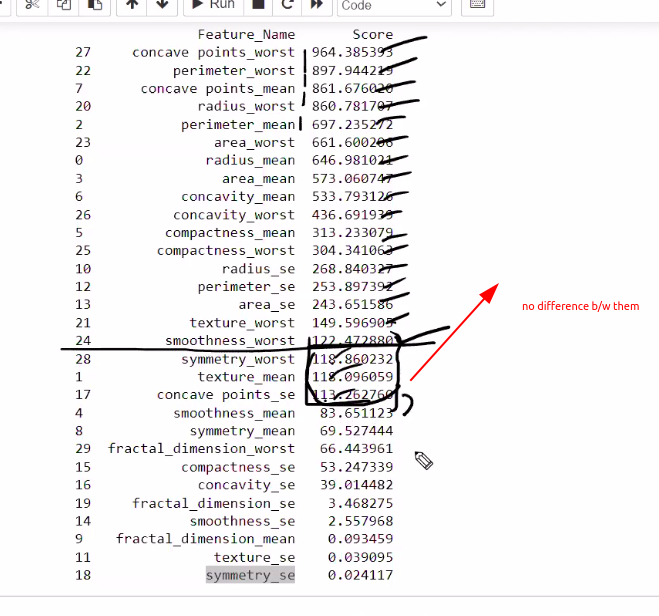
17 nlargest contribution feature in dataset using f1 score
choose how to select 17 (for k)see where to less differnce t
challenging part to decide k
feature selection is preprocessing technique
new way for feature selection to get value of k
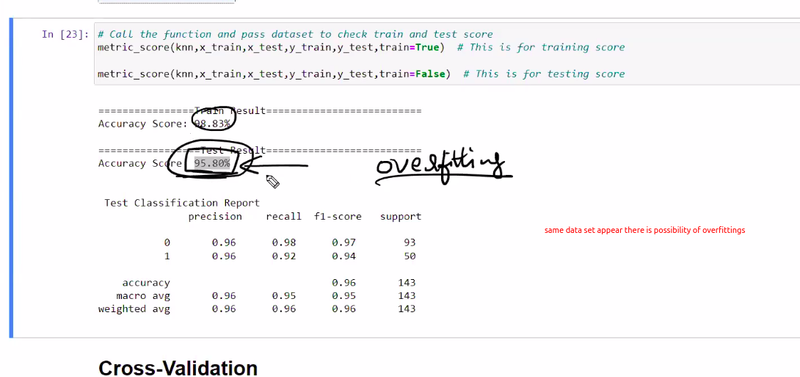
train is false then it is for testing
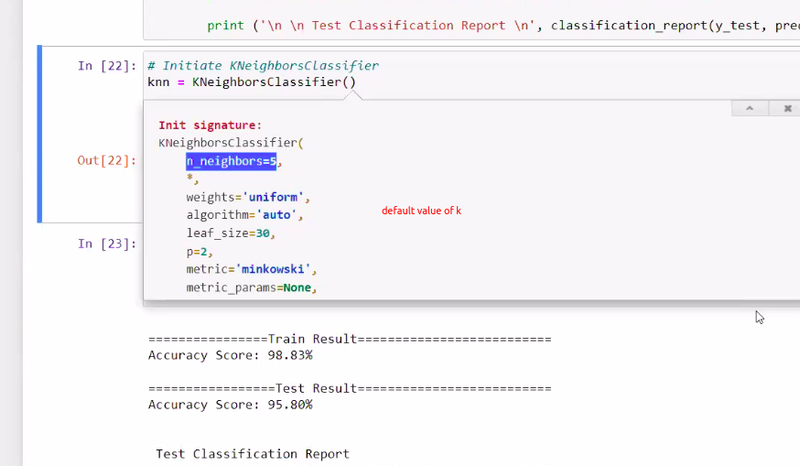
test classification report support means 93 % belongs one category
how to increase accuracy score after classificatin by hyperparameter tuning,cross validation
by default k no is 5 kneighbour
ig good score in accuracy score may be overfitting to avoid this by cross validation
tain test==
k fold cross validation
how many times fold k =5 5 times fold or spit
yellow cover for test
1 part for testing yellowother for traing green
every time testing part changes
leave on out of cross validation
if 100 sample then leave 1 for test remaining 99 % for training
difference between k fold cross validation and k fold validation
after cross val score also same accuracy score and not much difference between training and test result then it means no chance for overfittings
bias====if he always says same thing it is rainy day it is underfitting then it is bais saying same thing
variance== always fluctuate one week one pediction other week different prediction then it is called variance it is example of overfitting
bias trade off== we have to find prediction between underfitting and overfitting by hyperparameter tunning
==========================================================
What is machine learning, and how does it differ from traditional programming?
Explain the difference between supervised and unsupervised learning.
What is the bias-variance tradeoff in machine learning?
Describe the steps involved in a typical machine learning workflow.
What is overfitting in machine learning, and how can it be addressed?
What evaluation metrics are commonly used for classification problems?
Explain the concept of cross-validation and why it is useful.
Describe different feature selection techniques in machine learning.
What are the advantages and disadvantages of using decision trees for modeling?
Explain the difference between bagging and boosting in ensemble learning.
What is the purpose of regularization in machine learning, and how does it work?
Describe how the k-means clustering algorithm works.
What are the differences between L1 and L2 regularization?
Explain the concept of gradient descent and its role in optimizing machine learning models.
What are support vector machines (SVMs) and how do they work?
Describe the working principle of a neural network.
What is backpropagation and how does it relate to training neural networks?
Explain the concept of dimensionality reduction and give examples of techniques used for it.
What is the ROC curve, and how is it used to evaluate binary classification models?
Discuss the challenges and considerations when working with imbalanced datasets.
ADVANCED MACHINE LEARNING
========================================================
Explain the bias-variance tradeoff and how it relates to overfitting and underfitting.
What is the difference between bagging and boosting techniques in ensemble learning?
Describe the working principle behind support vector machines (SVMs) and how they handle non-linear data.
What is the concept of regularization in machine learning, and how does it prevent overfitting?
Explain the difference between generative and discriminative models. Provide examples of each.
What is deep learning, and how does it differ from traditional machine learning algorithms?
Discuss the differences between unsupervised, supervised, and semi-supervised learning.
Describe the concept of reinforcement learning and provide an example of how it can be applied in real-world scenarios.
Explain the working principle of recurrent neural networks (RNNs) and their applications.
How does gradient boosting differ from traditional gradient descent optimization algorithms?
What are the challenges associated with training deep neural networks, and how can they be addressed?
Discuss the concept of transfer learning and its benefits in machine learning tasks.
Explain the concept of autoencoders and their applications in dimensionality reduction and anomaly detection.
What is the attention mechanism in deep learning, and how does it improve model performance?
Describe the concept of word embeddings, such as Word2Vec or GloVe, and how they are generated.
prompt engeeneering tips and tricks for Data scientist
To become a better data scientist using prompt engineering, you need to integrate prompt engineering into every stage of your data science workflow. This approach not only boosts your productivity but also enhances the quality and relevance of your insights, especially when leveraging large language models (LLMs) like ChatGPT, Gemini, or Claude.
Below are expert tips and tricks—with practical examples—to help you master prompt engineering as a data scientist:
Core Prompt Engineering Principles
Be clear and specific: Precise prompts yield more accurate and relevant results. For example, instead of “analyze this dataset,” use “identify the top three features influencing target variable X in this dataset and explain their impact”.
Provide context: Always include relevant background, such as dataset descriptions, business objectives, or the modeling stage. This helps the model generate outputs tailored to your needs.
Iterate and refine: Prompt engineering is an iterative process. Test, review, and tweak your prompts based on the quality of the output.
Structure your output: Specify the desired format (e.g., bullet points, tables, JSON) to make integration with your workflow seamless.
Break down complex tasks: Use multi-step prompts to guide the model through each stage of a complex analysis (e.g., “First, summarize the dataset. Second, identify missing values. Third, suggest imputation methods.”).
Include examples: Show the model what kind of output you expect by providing sample inputs and outputs.
Practical Prompt Engineering Tips for Data Science
- Planning & Brainstorming
Ask LLMs to help define project scope, generate hypotheses, or suggest relevant features.
Example: “List five potential business questions we can answer with this sales dataset and suggest the required features for each.”
- Data Cleaning & Preprocessing
Use prompts to generate cleaning code or identify data quality issues.
Example: “Write Python code to detect and handle outliers in the ‘Age’ column of this DataFrame.”
- Exploratory Data Analysis (EDA)
Request summaries, visualizations, or pattern identification.
Example: “Summarize the main trends and anomalies in this time series data. Output as bullet points.”
- Feature Engineering & Modeling
Guide the model to suggest feature transformations or model choices.
Example: “Suggest three feature engineering techniques for improving a classification model on this dataset, and explain the rationale for each.”
- Evaluation & Interpretation
Ask for step-by-step explanations or code for model evaluation.
Example: “Explain the difference between precision and recall with examples, and provide code to calculate both for a binary classifier.”
- Documentation & Communication
Use prompts to auto-generate documentation, reports, or stakeholder summaries.
Example: “Write a non-technical summary of this model’s findings for business stakeholders.”
====================================================
51 Essential Machine Learning Interview Questions and Answers
https://www.educative.io/blog/top-machine-learning-interview-questions
https://www.mygreatlearning.com/blog/machine-learning-interview-questions/
Top 50 Machine Learning Interview Questions in 2023

Top comments (0)