Heatmaps and scatter plots are valuable visualization tools to identify multicollinearity and avoid overfitting in machine learning models. Let's explore how each of these visualizations helps in these scenarios with detailed examples.
Role of Heatmap:
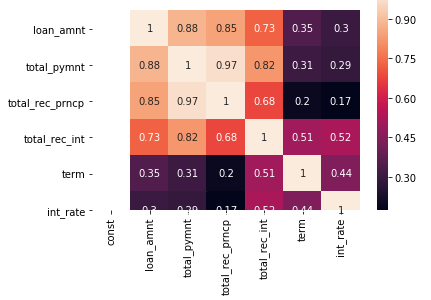
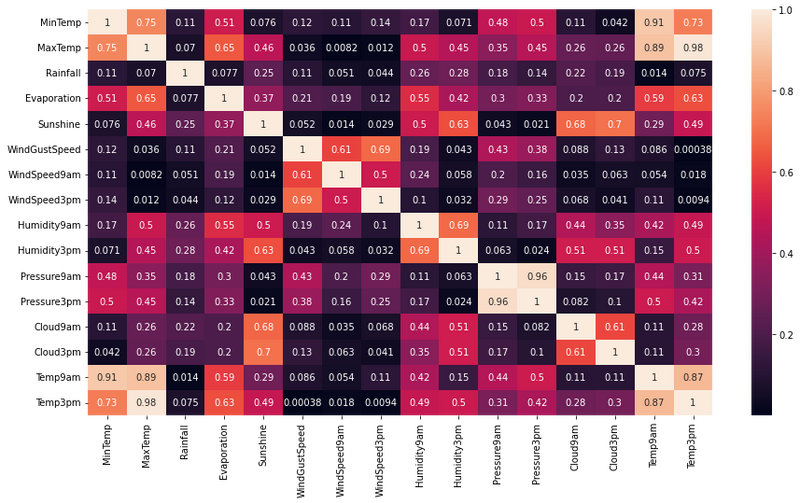
A heatmap is a graphical representation of data where individual values are represented as colors in a grid. In the context of machine learning, heatmaps are commonly used to visualize the correlation between features (variables) in a dataset. High correlation between features can indicate multicollinearity, which is a situation where two or more independent variables are highly linearly related to each other.
Example:
Suppose you have a dataset with three features: "Age," "Income," and "Savings." To identify multicollinearity, you can calculate the correlation matrix of these features and visualize it as a heatmap.
import pandas as pd
import seaborn as sns
import matplotlib.pyplot as plt

# Sample data
data = {
    'Age': [30, 40, 25, 35, 28],
    'Income': [50000, 60000, 40000, 55000, 48000],
    'Savings': [10000, 12000, 8000, 11000, 9000]
}

df = pd.DataFrame(data)

# Calculate correlation matrix
correlation_matrix = df.corr()

# Plot heatmap
sns.heatmap(correlation_matrix, annot=True, cmap='coolwarm', center=0)
plt.title("Correlation Heatmap")
plt.show()
In this example, if the correlation between "Age" and "Income" or "Age" and "Savings" is close to 1 or -1, it suggests that there is a strong linear relationship between these variables, indicating potential multicollinearity. In such cases, it may be necessary to remove one of the correlated features to avoid redundancy and improve model performance.
Role of Scatter Plot:
Scatter plots are used to visualize the relationship between two continuous variables. They help in understanding the distribution of data points and detecting non-linear patterns, which is crucial for identifying and avoiding overfitting.
Example:
Let's consider a regression problem with two features, "X" and "Y," and a target variable "Z." We want to visualize the relationship between the features and the target using scatter plots.
import numpy as np
import matplotlib.pyplot as plt

# Sample data
np.random.seed(42)
X = np.random.rand(100)
Y = 2 * X + 1 + np.random.randn(100)
Z = 4 * X - 2 * Y + np.random.randn(100)

# Plot scatter plot for X vs. Z
plt.scatter(X, Z)
plt.xlabel('X')
plt.ylabel('Z')
plt.title('Scatter Plot: X vs. Z')
plt.show()

# Plot scatter plot for Y vs. Z
plt.scatter(Y, Z)
plt.xlabel('Y')
plt.ylabel('Z')
plt.title('Scatter Plot: Y vs. Z')
plt.show()
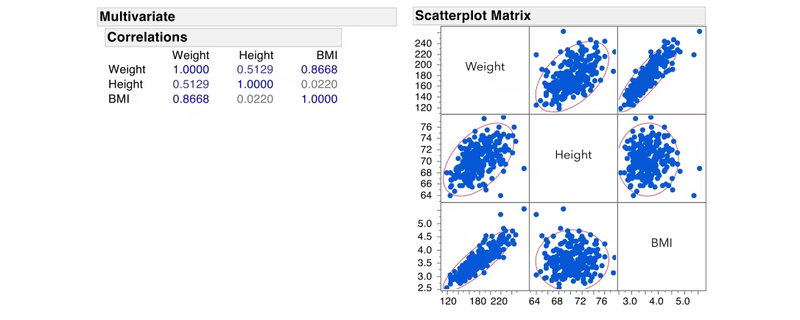
In this example, if the scatter plots show a linear relationship between the features and the target variable, it suggests that the model can potentially fit the data well. However, if the scatter plots exhibit complex, non-linear patterns, it indicates that a linear model might not be the best fit, and using a more flexible model may be necessary to avoid overfitting.
In summary, heatmaps and scatter plots are powerful tools for identifying multicollinearity and avoiding overfitting in machine learning models. By visualizing the relationships between features and the target variable, you can gain insights into the data and make informed decisions about feature selection and model complexity.

Top comments (0)