There are two key aspects that make up the object detection
model performance: speed and accuracy.
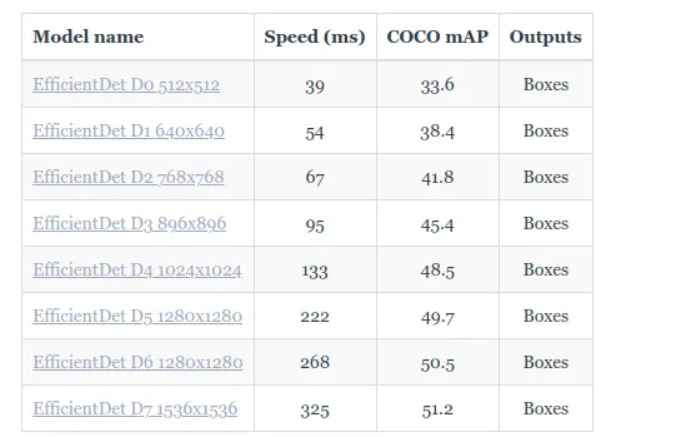
There’s always a tradeoff between the two as can be seen in the table below. In this blog, we’ll focus exclusively on analyzing the model accuracy.
In a nutshell, object detectors predict the location of objects of a given class in an image with a certain confidence score. Locations of the objects are defined by placing bounding boxes around the objects to identify their position.
Therefore, a detection is represented by a set of three attributes:
object class (i.e. person)
corresponding bounding box (i.e. [63, 52, 150, 50])
confidence score (i.e. 0.583 or 58.3%)
Similarly, the performance evaluation of the object detection model is done based on:
a set of ground-truth bounding boxes representing the rectangular areas of an image containing objects of the class to be detected,
a set of detections predicted by a model, each one consisting of a bounding box, a class, and a confidence value.
IoU and confidence score
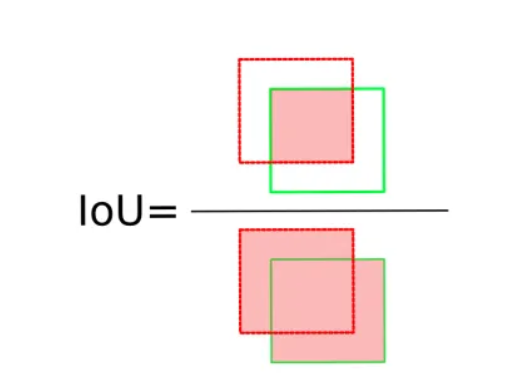
Consider an object of interest (person) represented by a ground-truth bounding box (green color) and the detected area represented by a predicted bounding box (red color) in the image below. Without taking into account the confidence score, a perfect match occurs when the area and location of the predicted and ground-truth boxes are the same, i.e. perfectly bounding the person.

These two conditions are assessed by the intersection over union (IoU), a measurement based on the Jaccard index, a coefficient of similarity for two sets of data. In the object detection scope, the IoU is equal to the area of the overlap (intersection) between the predicted bounding box (red) and the ground-truth bounding box (green) divided by the area of their union.
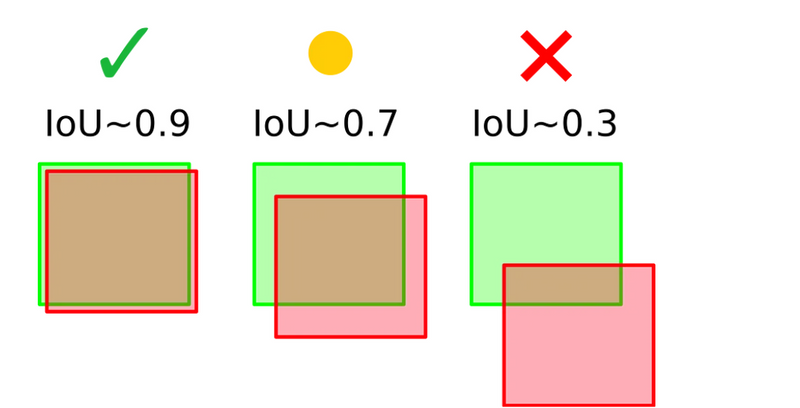
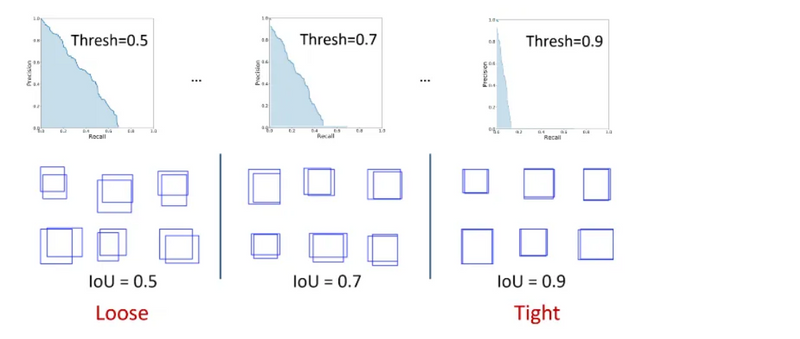
A few examples of different IoU scores can be seen in the image below. By setting an IoU threshold, a metric can be more or less restrictive on considering detections as correct or incorrect. An IoU threshold closer to 1 is more restrictive as it requires almost perfect detections, while an IoU threshold closer to, but different than 0 is more flexible, considering even small overlaps as valid detections.
The confidence score reflects how likely the box contains an object of interest and how confident the classifier is about it. If no object exists in that box, the confidence score should ideally be zero. In general, the confidence score tends to be higher for tighter bounding boxes (strict IoU).
Precision and recall
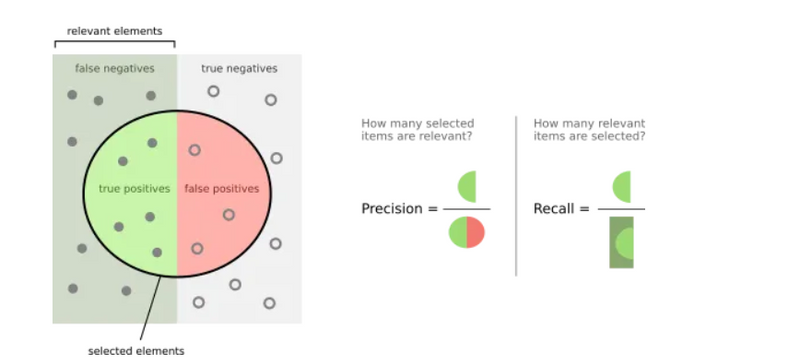
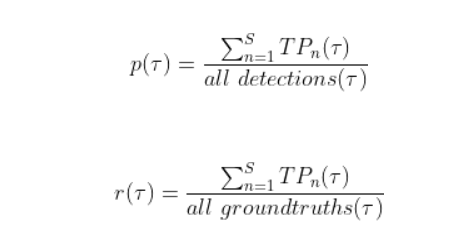
Precision (Pr) is the ability of a model to identify only relevant objects and is calculated as the percentage of correct positive predictions.
Recall (Rc) is the ability of a model to find all relevant cases (all ground-truth bounding boxes). It is the percentage of correct positive predictions among all given ground truths.
To calculate the precision and recall values, each detected bounding box must first be classified as:
True-positive (TP) — a correct detection of a ground-truth bounding box;
False-positive (FP) — incorrect detection of a non-existing object or a misplaced detection of an existing object;
False-negative (FN) — an undetected ground-truth bounding box;
True Negative (TN) — does not apply to object detection because there are infinitely many instances that should not be detected as objects.
To recap, the output of an object detector is characterized by a bounding box, a class, and a confidence score. The confidence score can be taken into account in the precision and recall calculations by considering as positive detections only those whose confidence is larger than a confidence threshold τ. The detections whose confidence level is smaller than τ are considered as negatives.
Both TP(τ) and FP(τ) are decreasing functions of τ, as a larger τ reduces the number of positive detections. Conversely, FN(τ) is an increasing function of τ, since less positive detections imply a larger number of negative detections.
Average Precision (AP)
The precision-recall (PR) curve is a plot of precision as a function of recall. It shows the trade-off between the two metrics for varying confidence values for the model detections. AP@α is the Area Under the precision-recall curve (AUC-PR). Mathematically, AP is defined as:
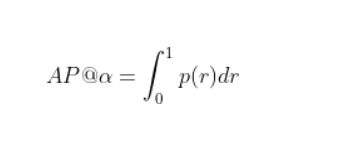
Notation: AP@α means Average Precision(AP) at the IoU threshold of α. Therefore AP@0.50 and AP@0.75 mean AP at IoU threshold of 50% and 75% respectively.

A high AUC-PR implies high precision and high recall. Naturally, the PR curve has a zig-zag behavior (not monotonically decreasing). Before calculating the AP, we make the PR curve to be monotonically decreasing using the following interpolation formula:
After we calculate the AP for each individual class, we calculate the mean AP as an average of all AP for all classes:
In the image below, we can see three different PR curves and they differ by the IoU threshold used in the precision/recall calculation. Since the AP corresponds to the area under the curve, it is obvious that a loose IoU threshold results in a higher AP score than a strict IoU threshold.

Top comments (0)